
Visualize Results
Once you find your project status as 'Completed', click the name of your project to view the results.
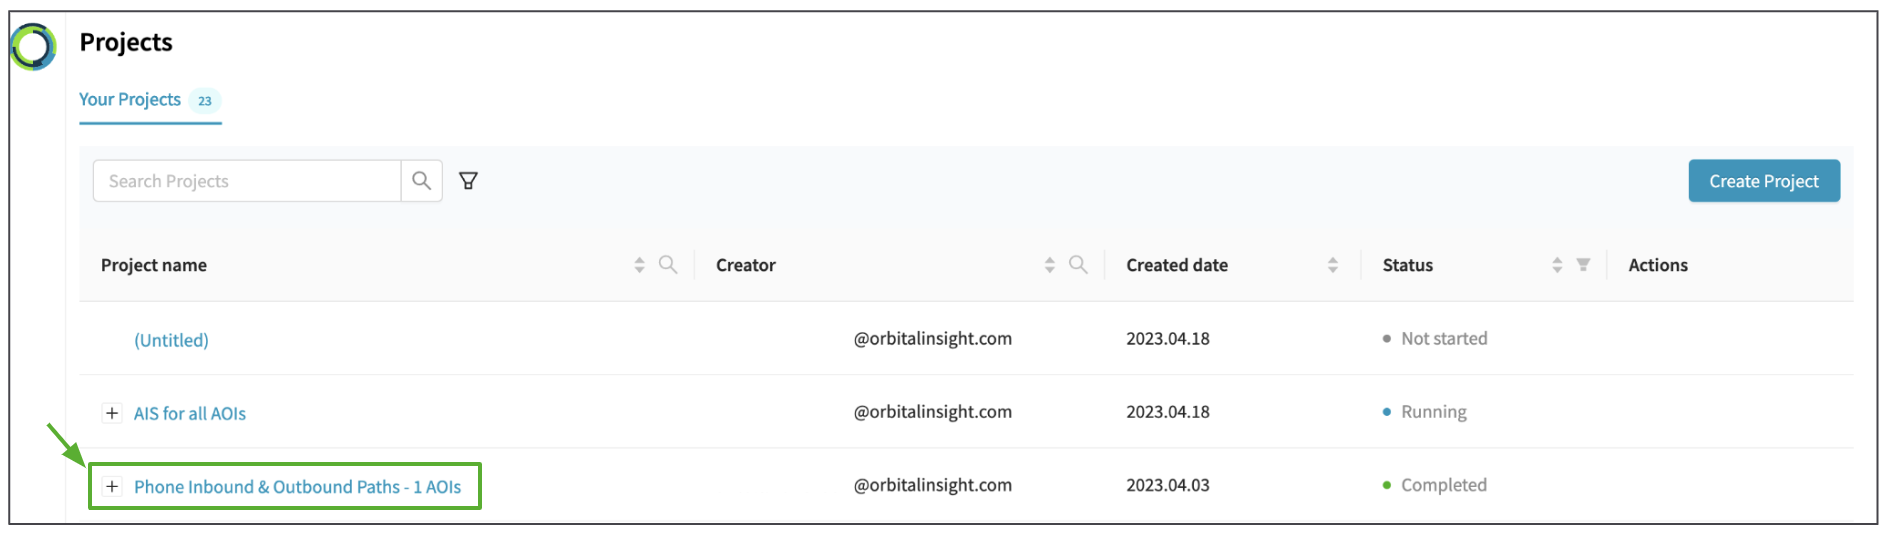
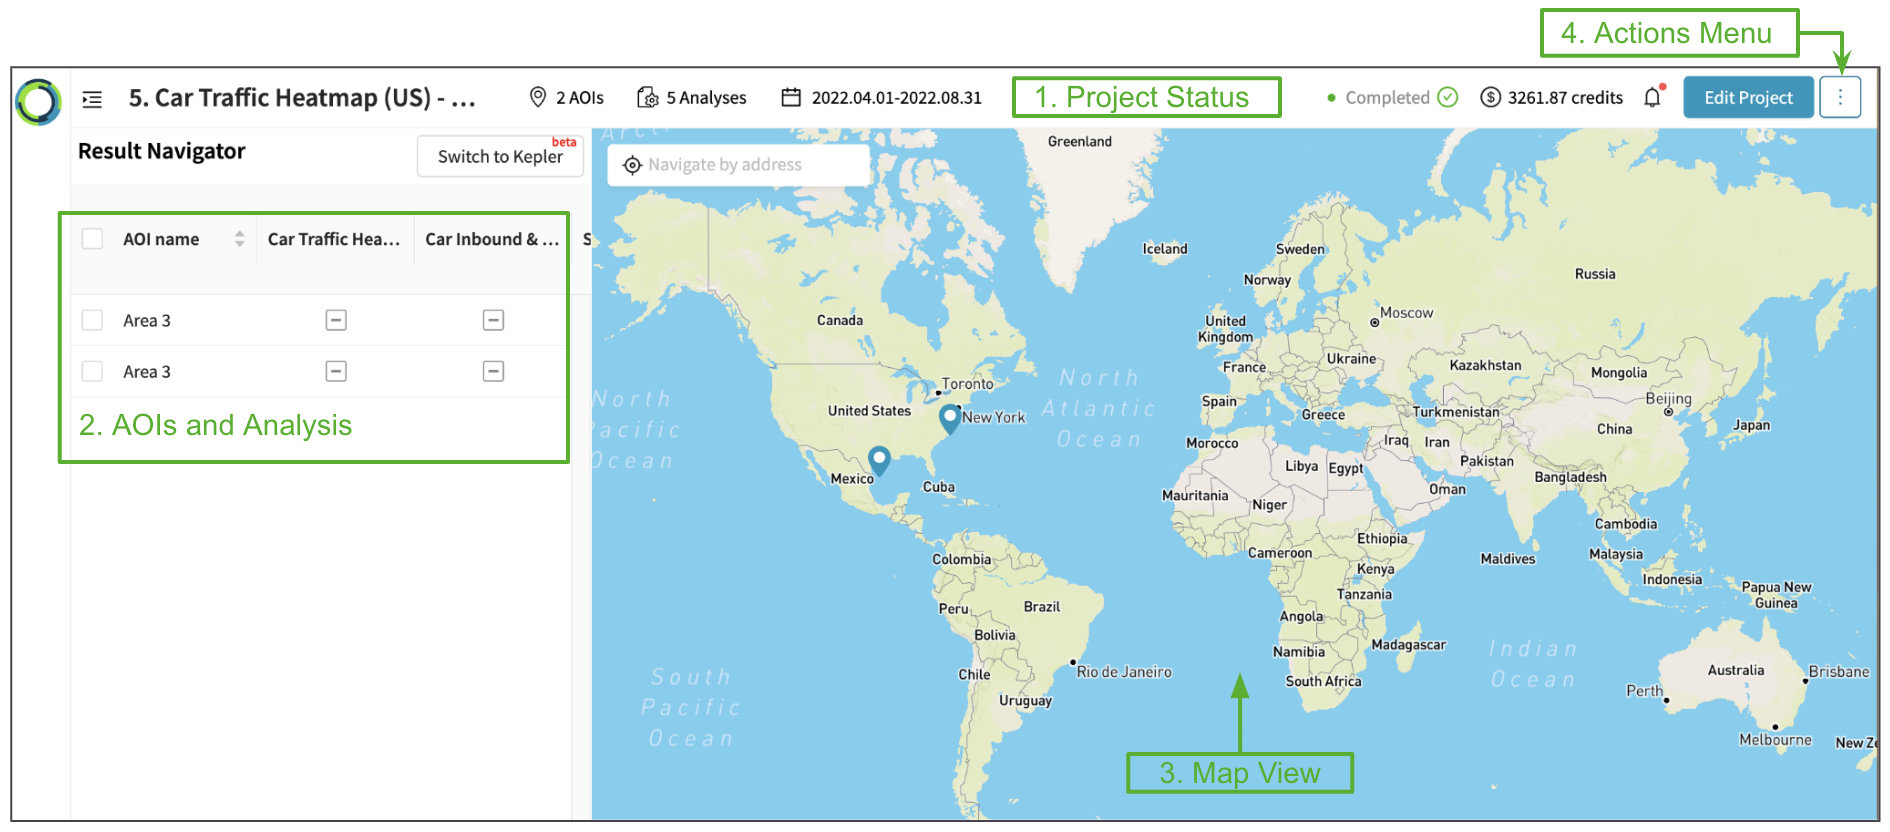
You will be directed to the 'Results' page where you can visualize the Analysis results with following information.
- The project status (project name, date range, consumed credit, etc) are shown at the top.
- AOIs and Analyses are laid out on the left, allowing you to navigate between results for each AOI and Analysis.
- The map view initially shows you all project AOIs. As you click into results for an AOI, the map will display spatial results for that AOI.
- The actions menu at the top-right allows you to:
- Copy Project ID
- Share Project (Beta)
- Delete Project
- Download Results
The Elements user interface allows you to quickly view results in spatial (eg object detection geometries) & temporal (time series) dimensions.
Read the next sections for details of the visualization for each Analysis category:
- Object Detection
- Geolocation
- Land Use
- Comparing across multiple AOIs and Analysis
Updated 6 months ago