
Geolocation
Depending on the selected Analysis, either spatial or temporal data is available as below:
- Traffic: Temporal: how many devices are counted in the AOI on each day(time series data)
- Traffic Heatmap: Spatial: where devices are located within the AOI, on each day (heatmap)
- Tracks: Spatial: where devices are located before and after arriving at the AOI (heatmap)
Read the next sections for details of the visualization for each Analysis:
1. Traffic
Traffic results contain temporal data:
- Temporal: how many devices are counted in the AOI on each day(time series data)
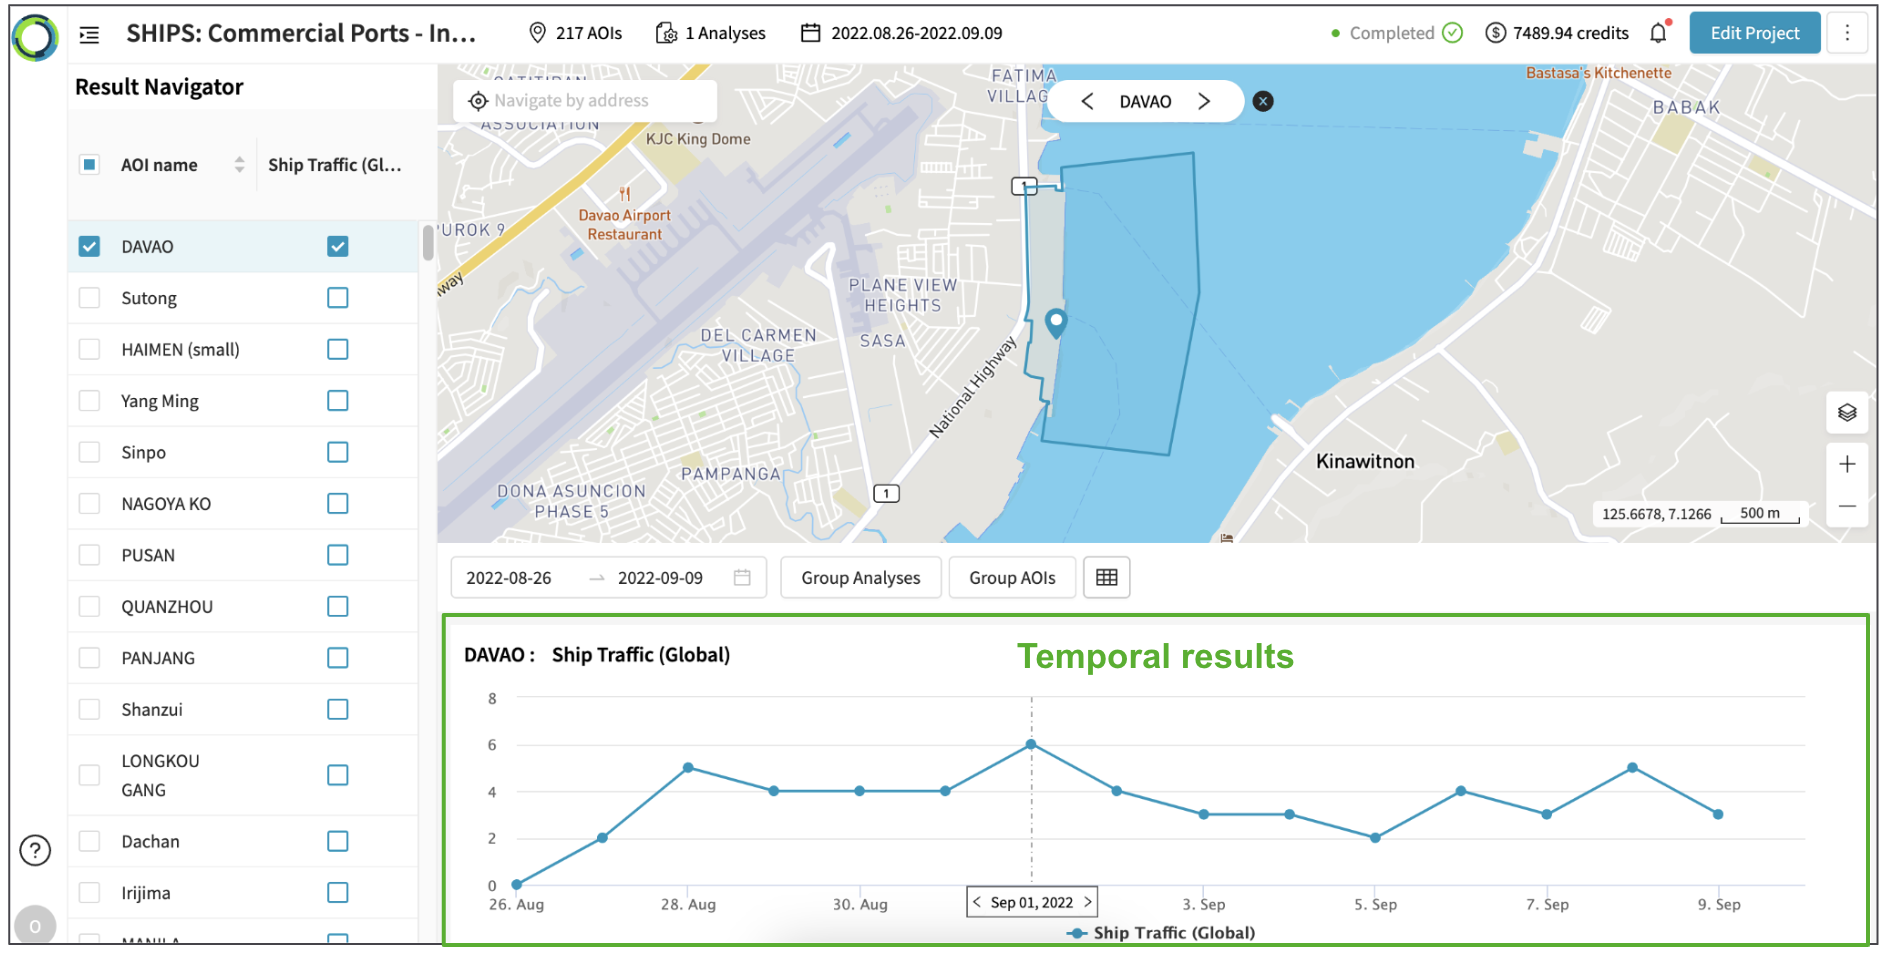
Explore Traffic results following the steps below:
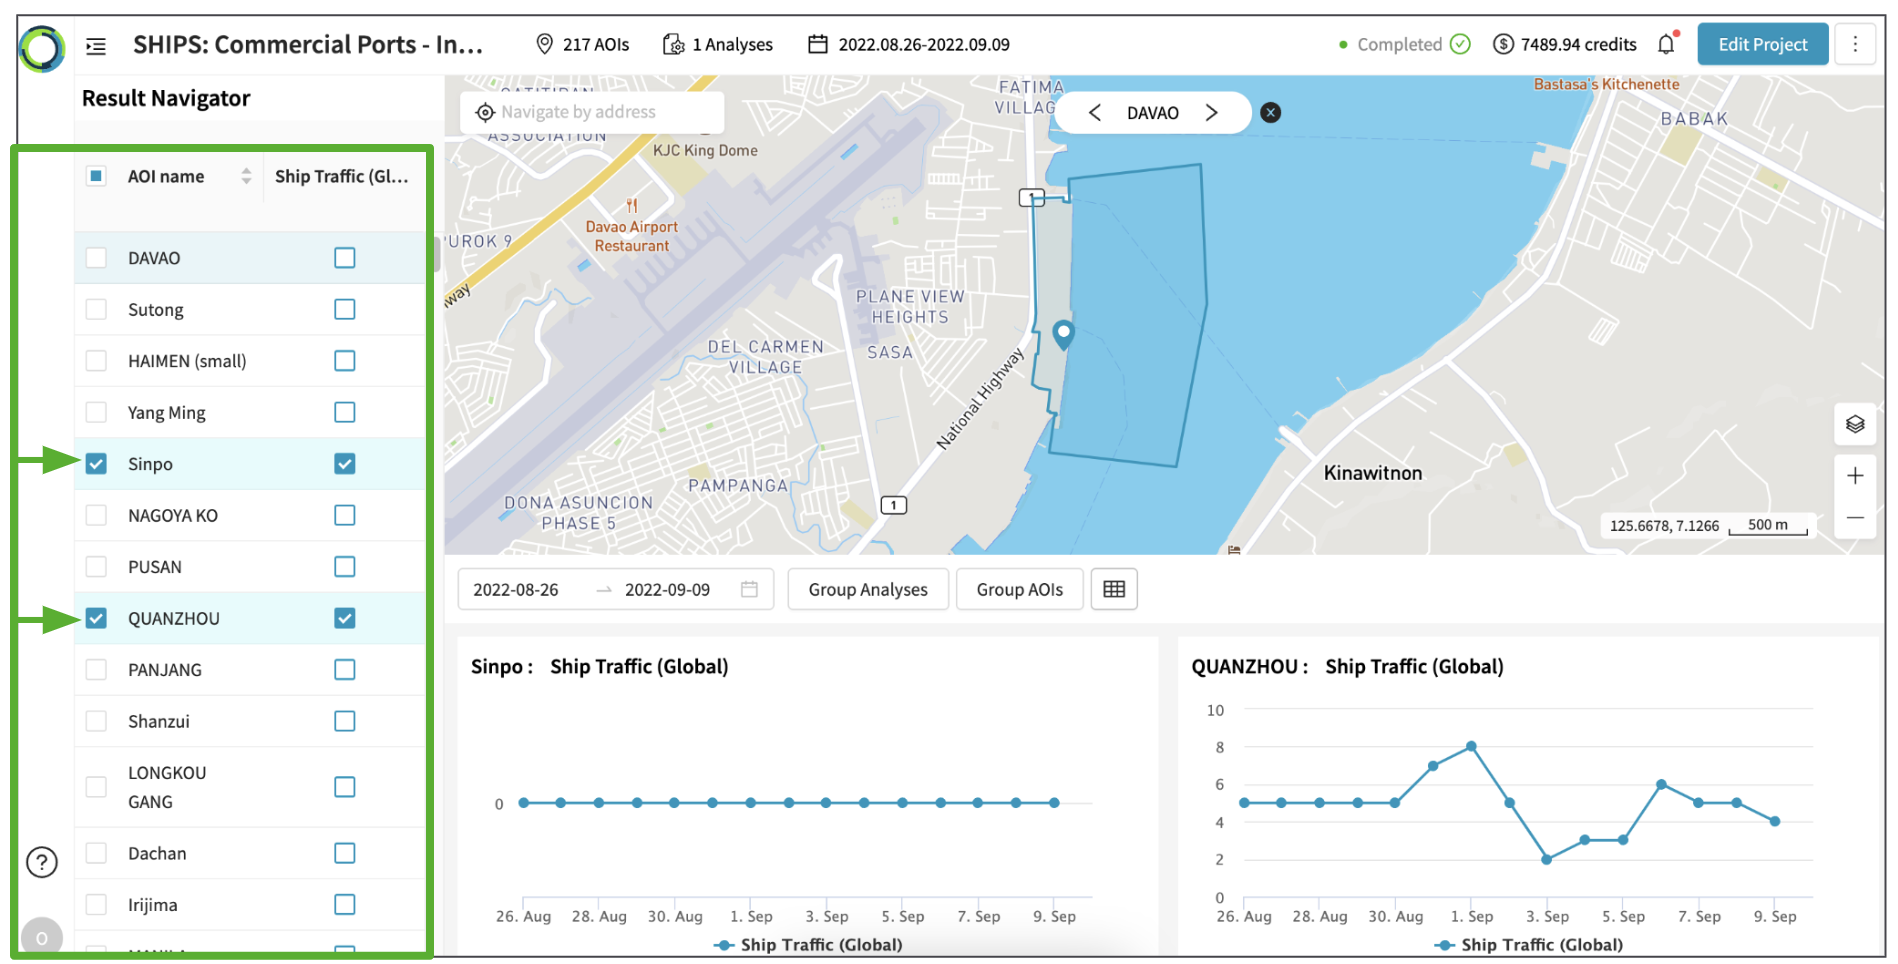
- In the left-hand panel, click the checkbox of the AOI and Analysis to visualize their results.
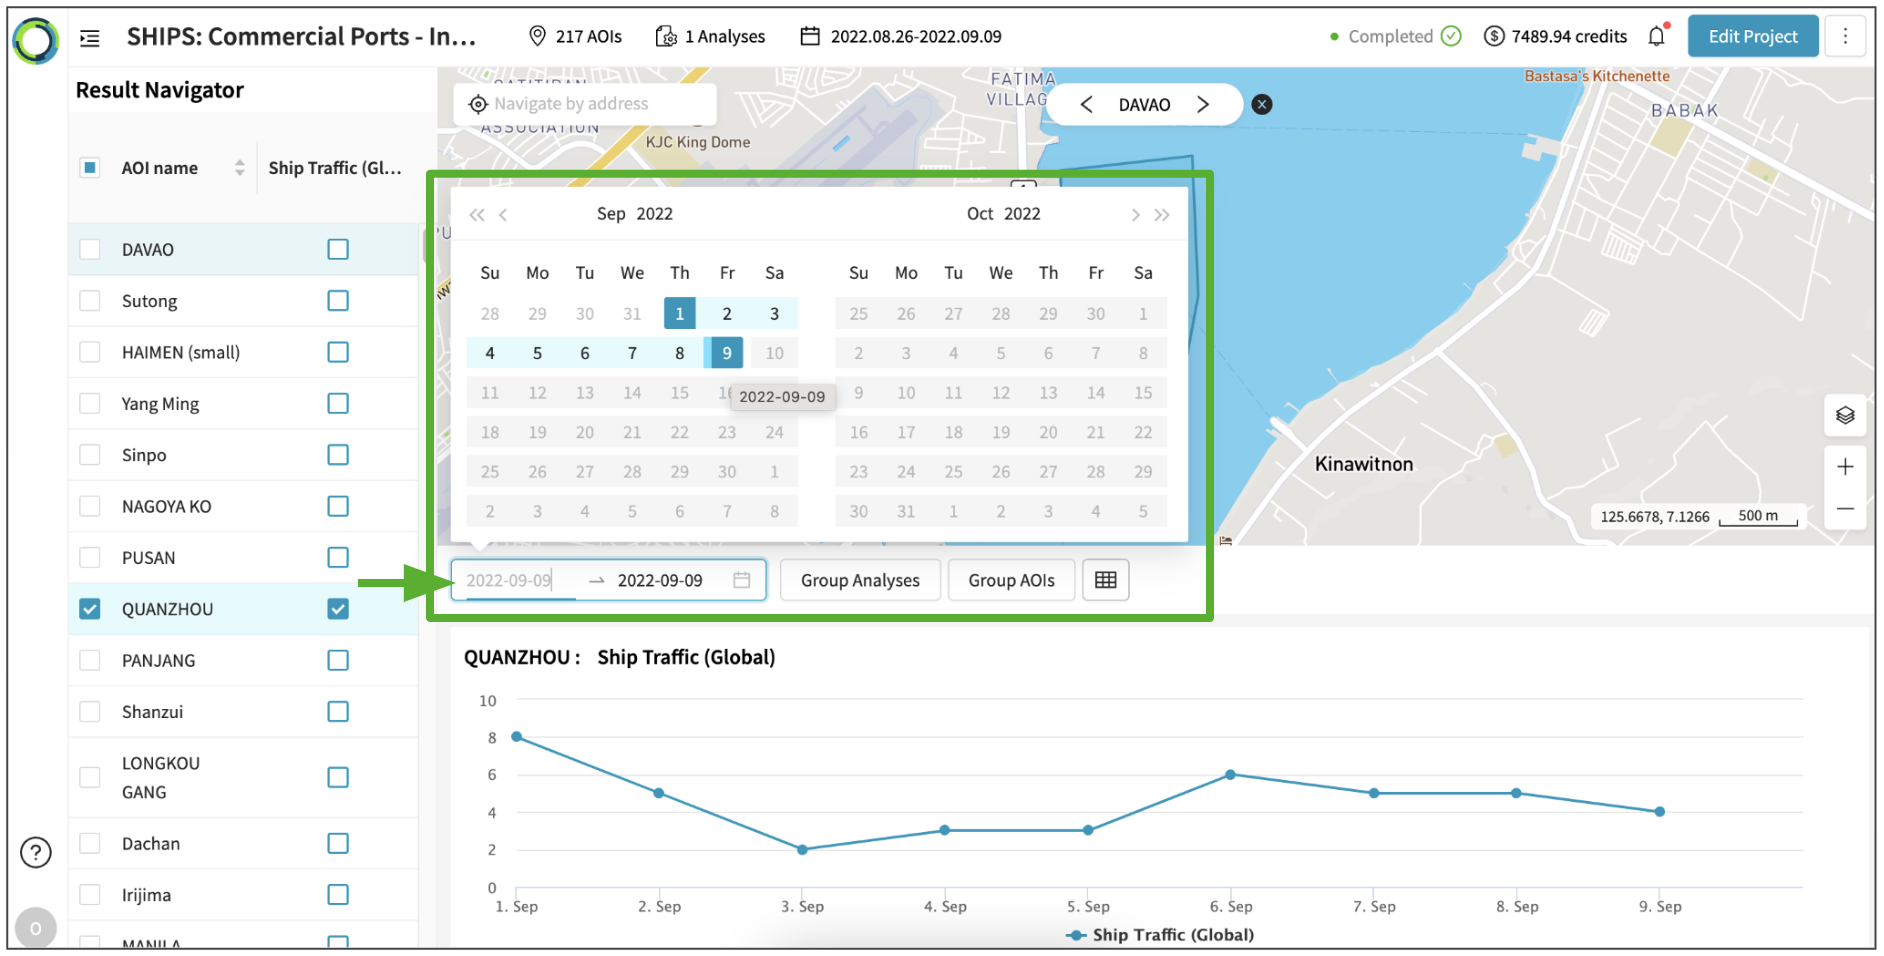
- Zoom into a specific date range by using the date range selector.
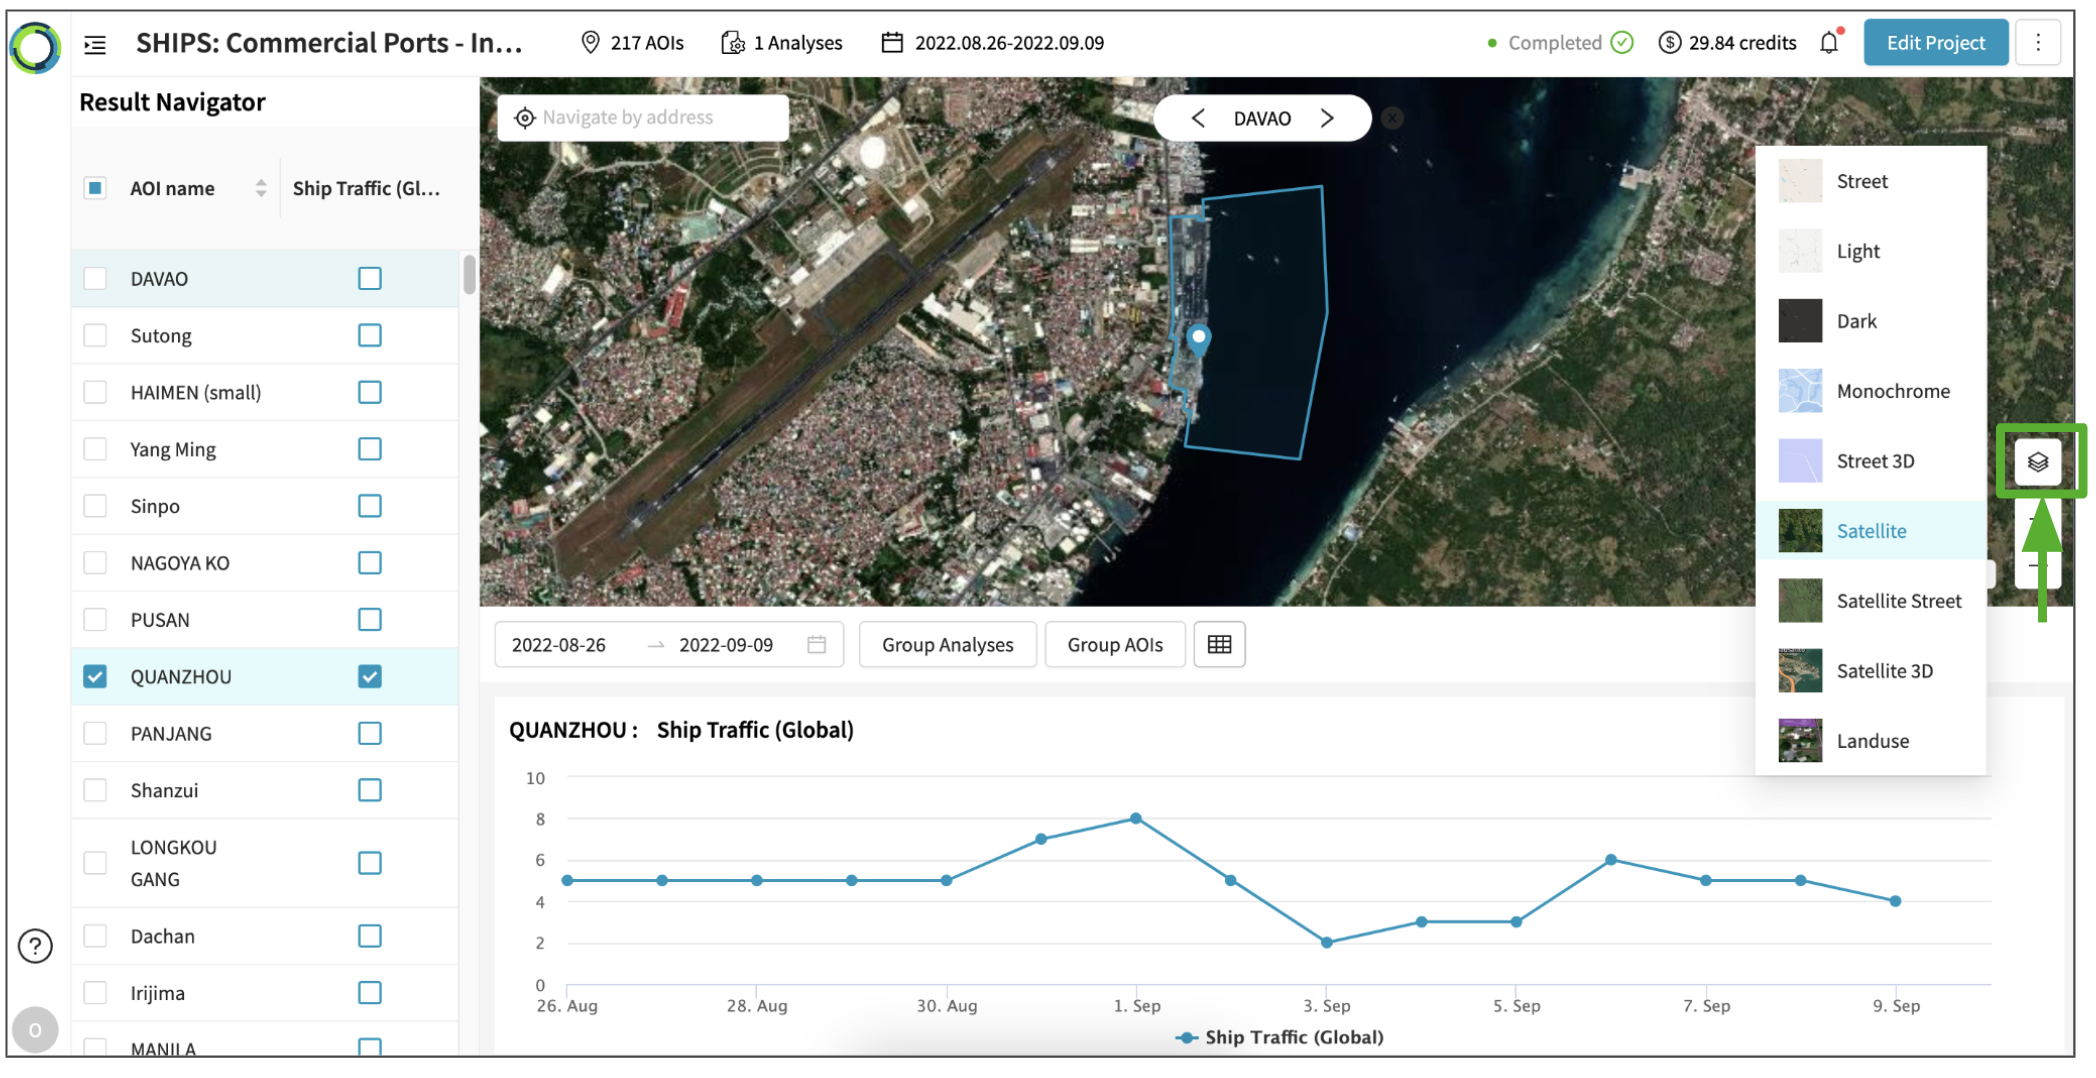
- If necessary, change basemap for the map view by clicking on Basemap toggle in the bottom-right corner.
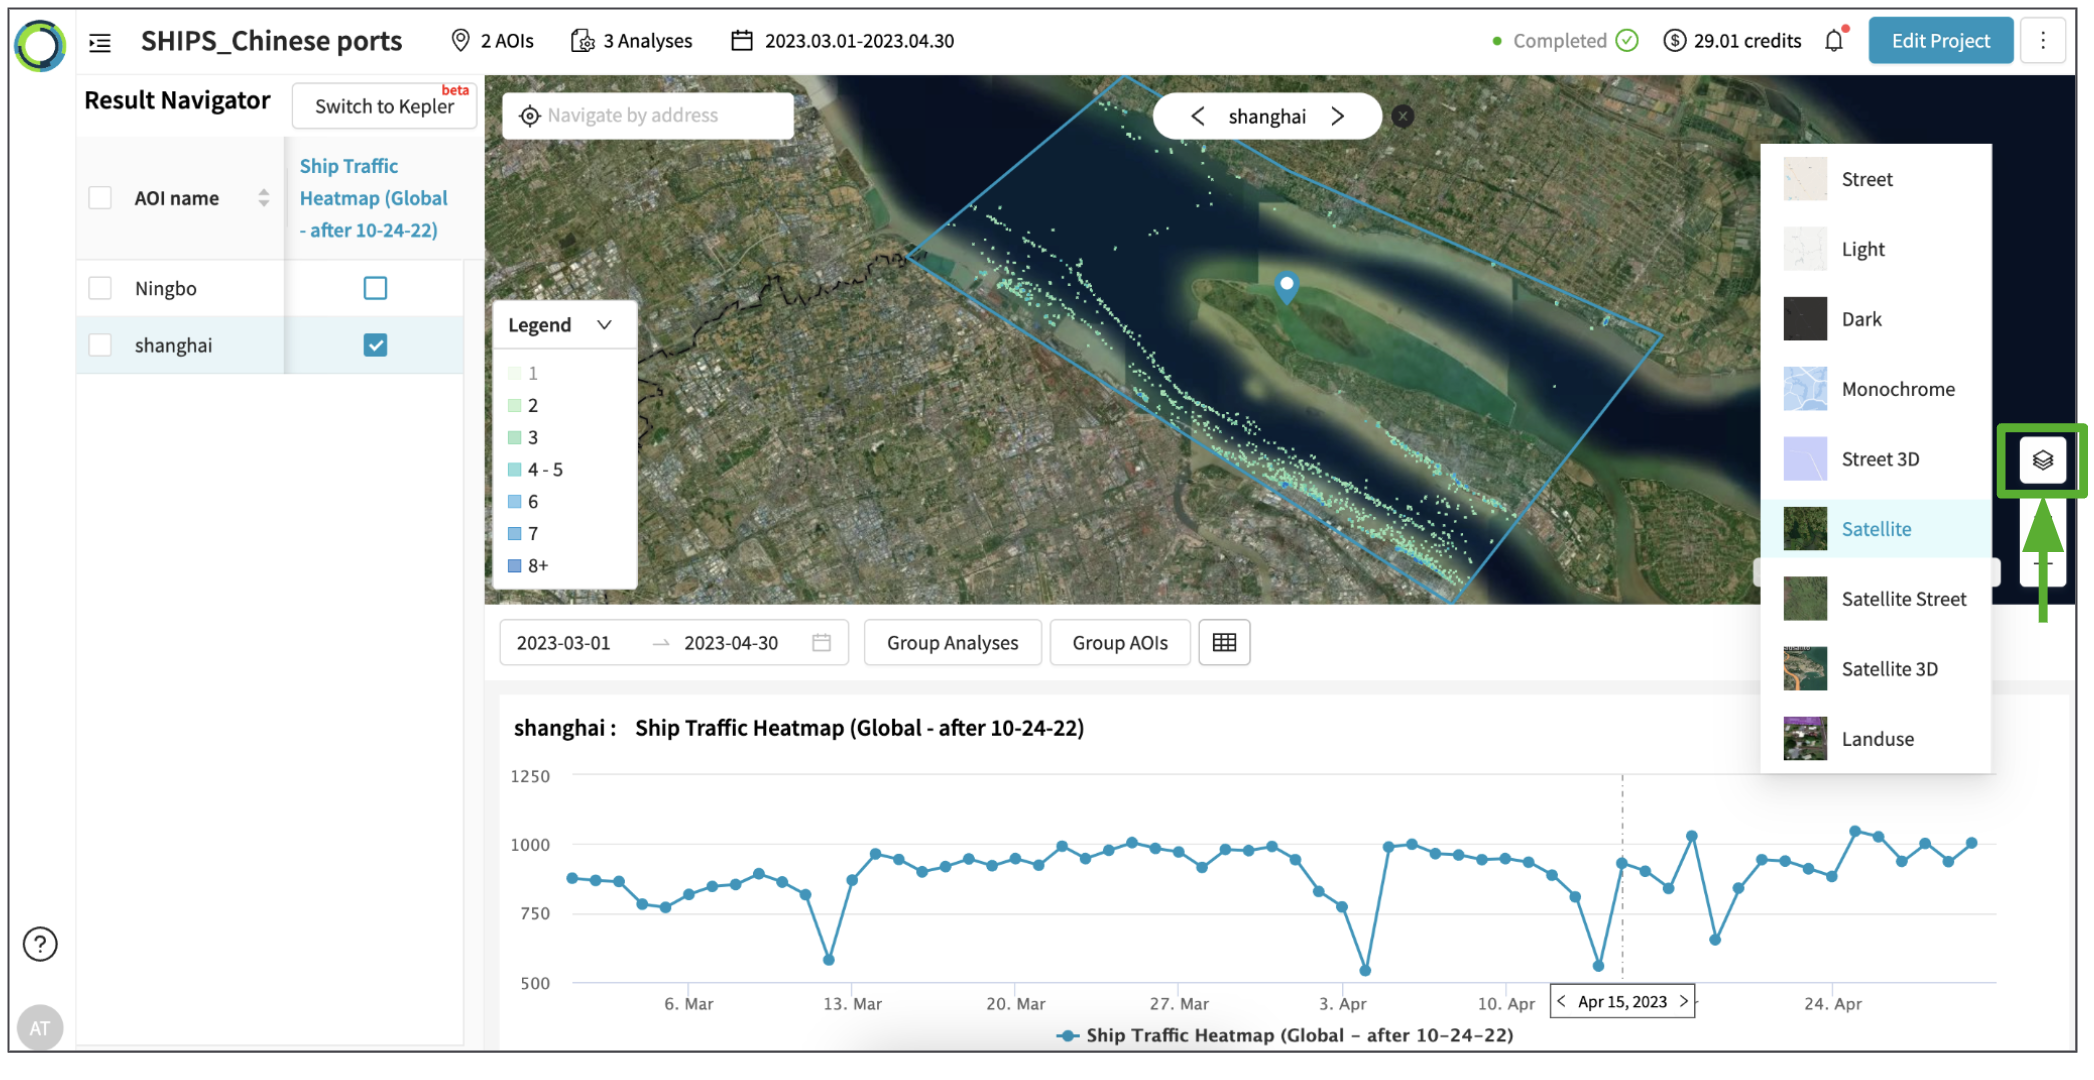
2. Traffic Heatmap
Traffic heatmap results contain spatial data:
- Spatial: where devices are located within the AOI, on each day (heatmap)
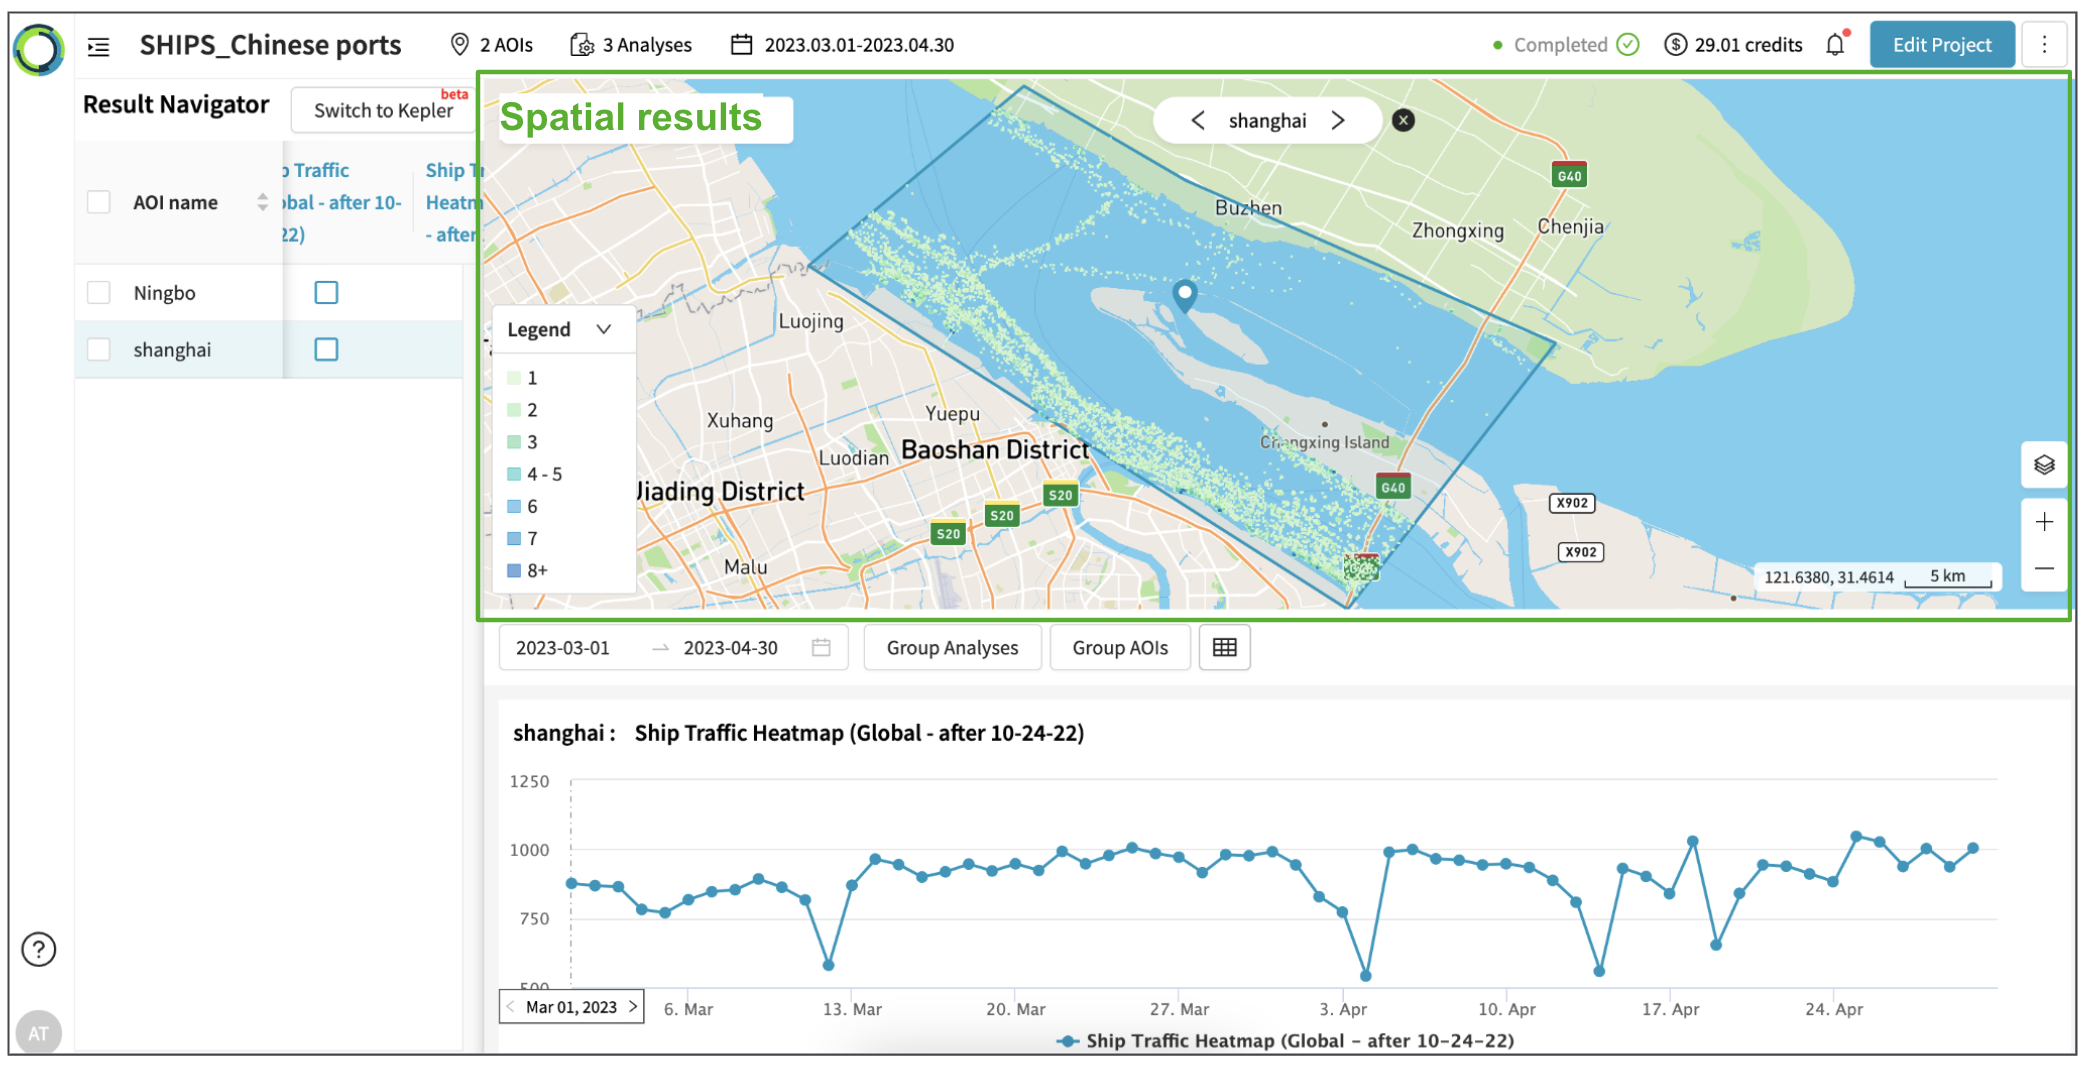
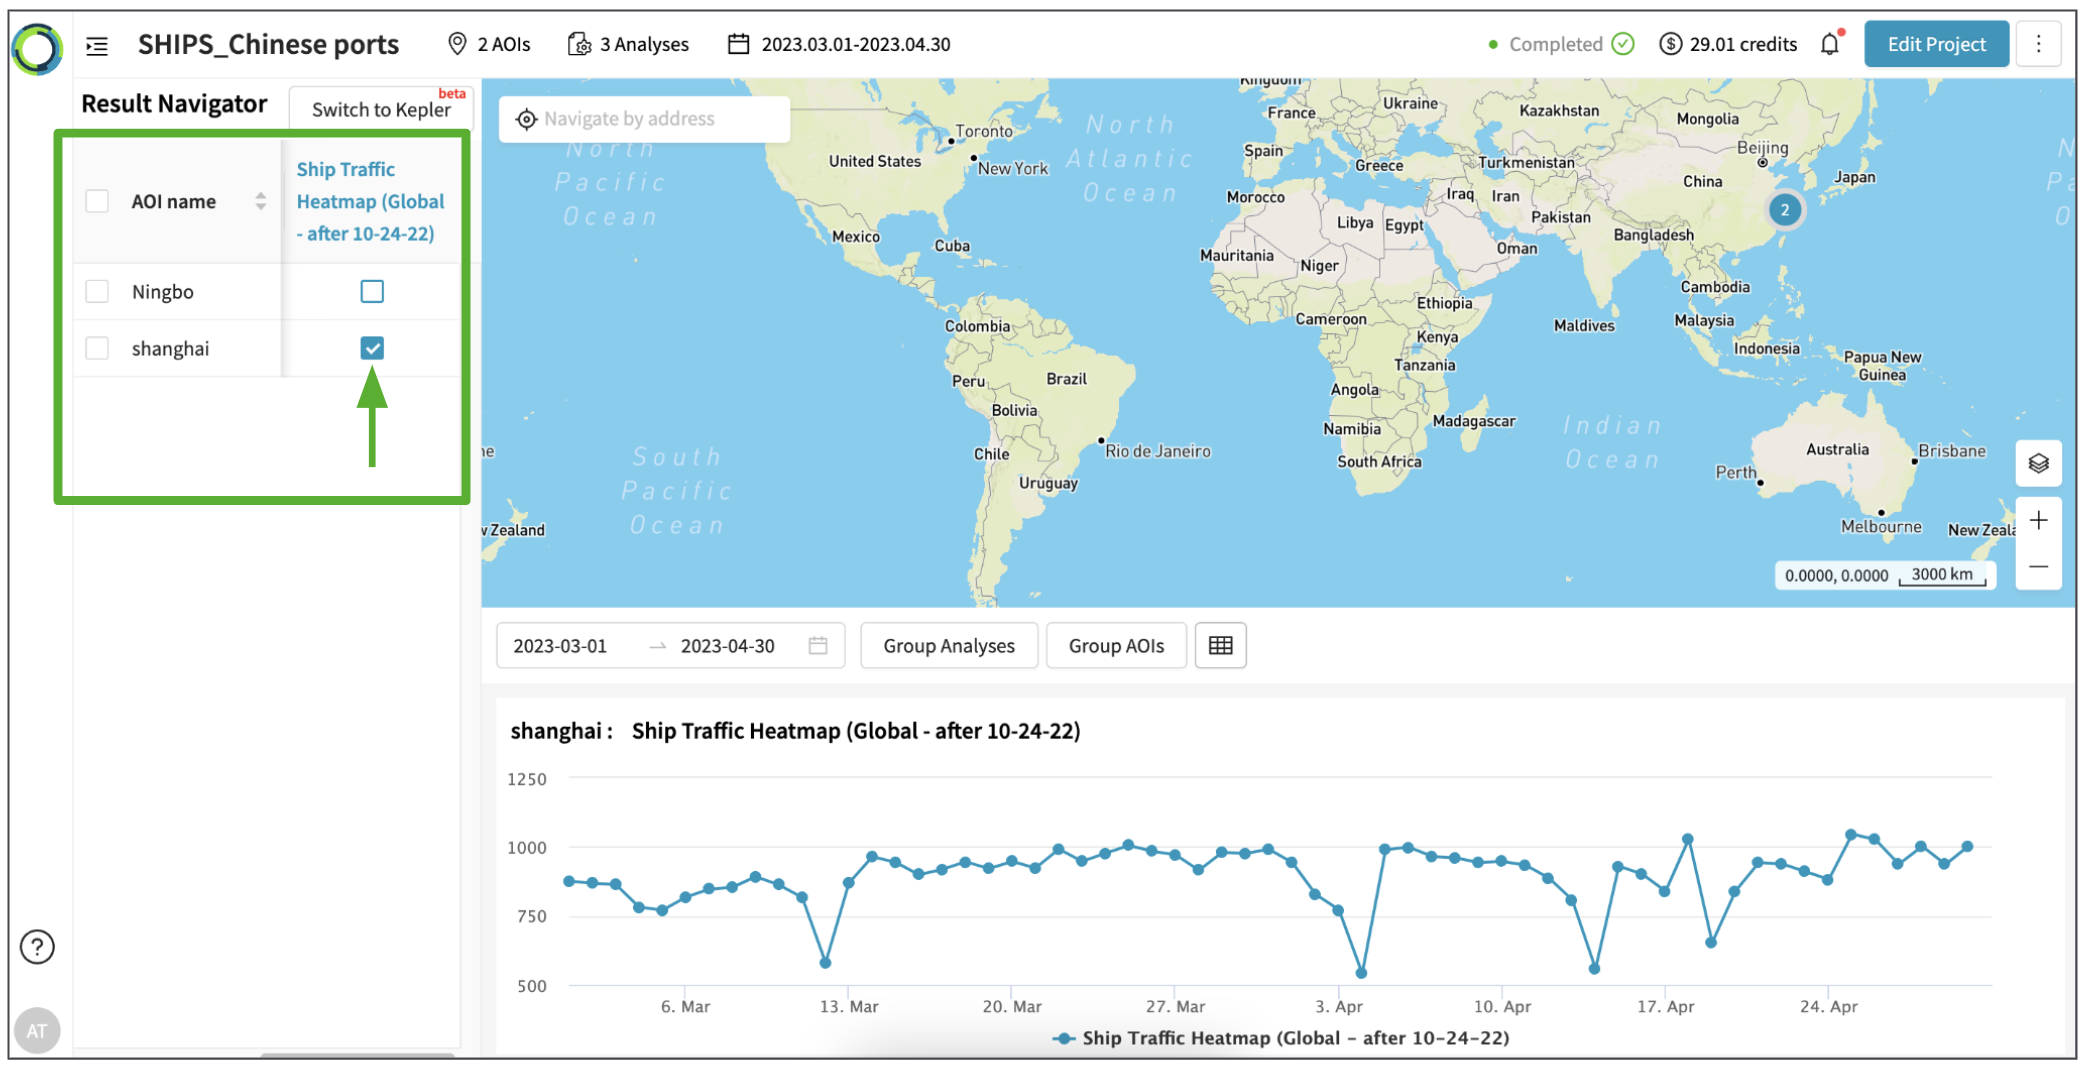
Explore Traffic Heatmap results following the steps below:
- In the left-hand panel, click the checkbox that correspond to the AOI and Heatmap Analysis you want to visualize their results. (you may only visualize the heatmap result of one AOI at a time)
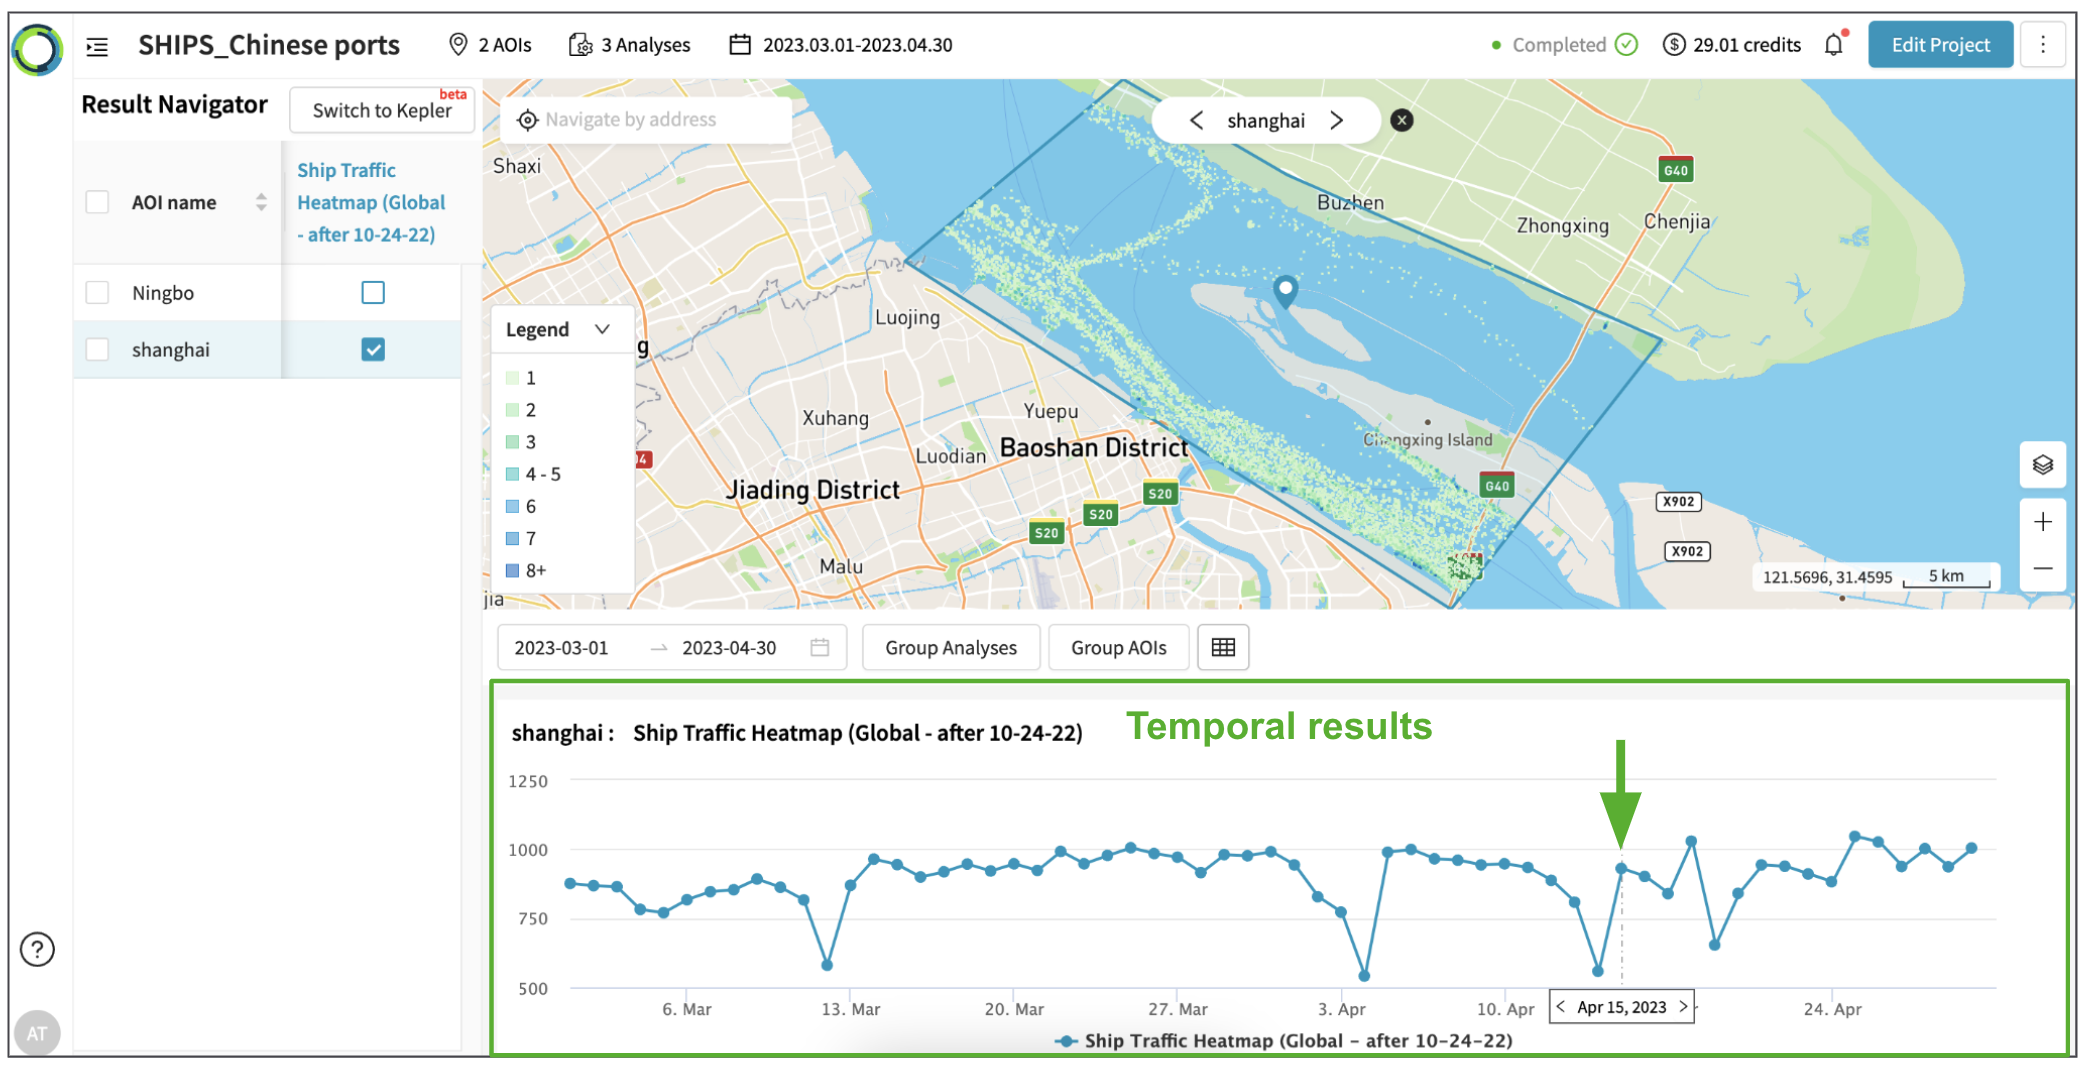
- Visualize spatial results of a specific date by clicking on the data-points within the temporal results (time series chart).
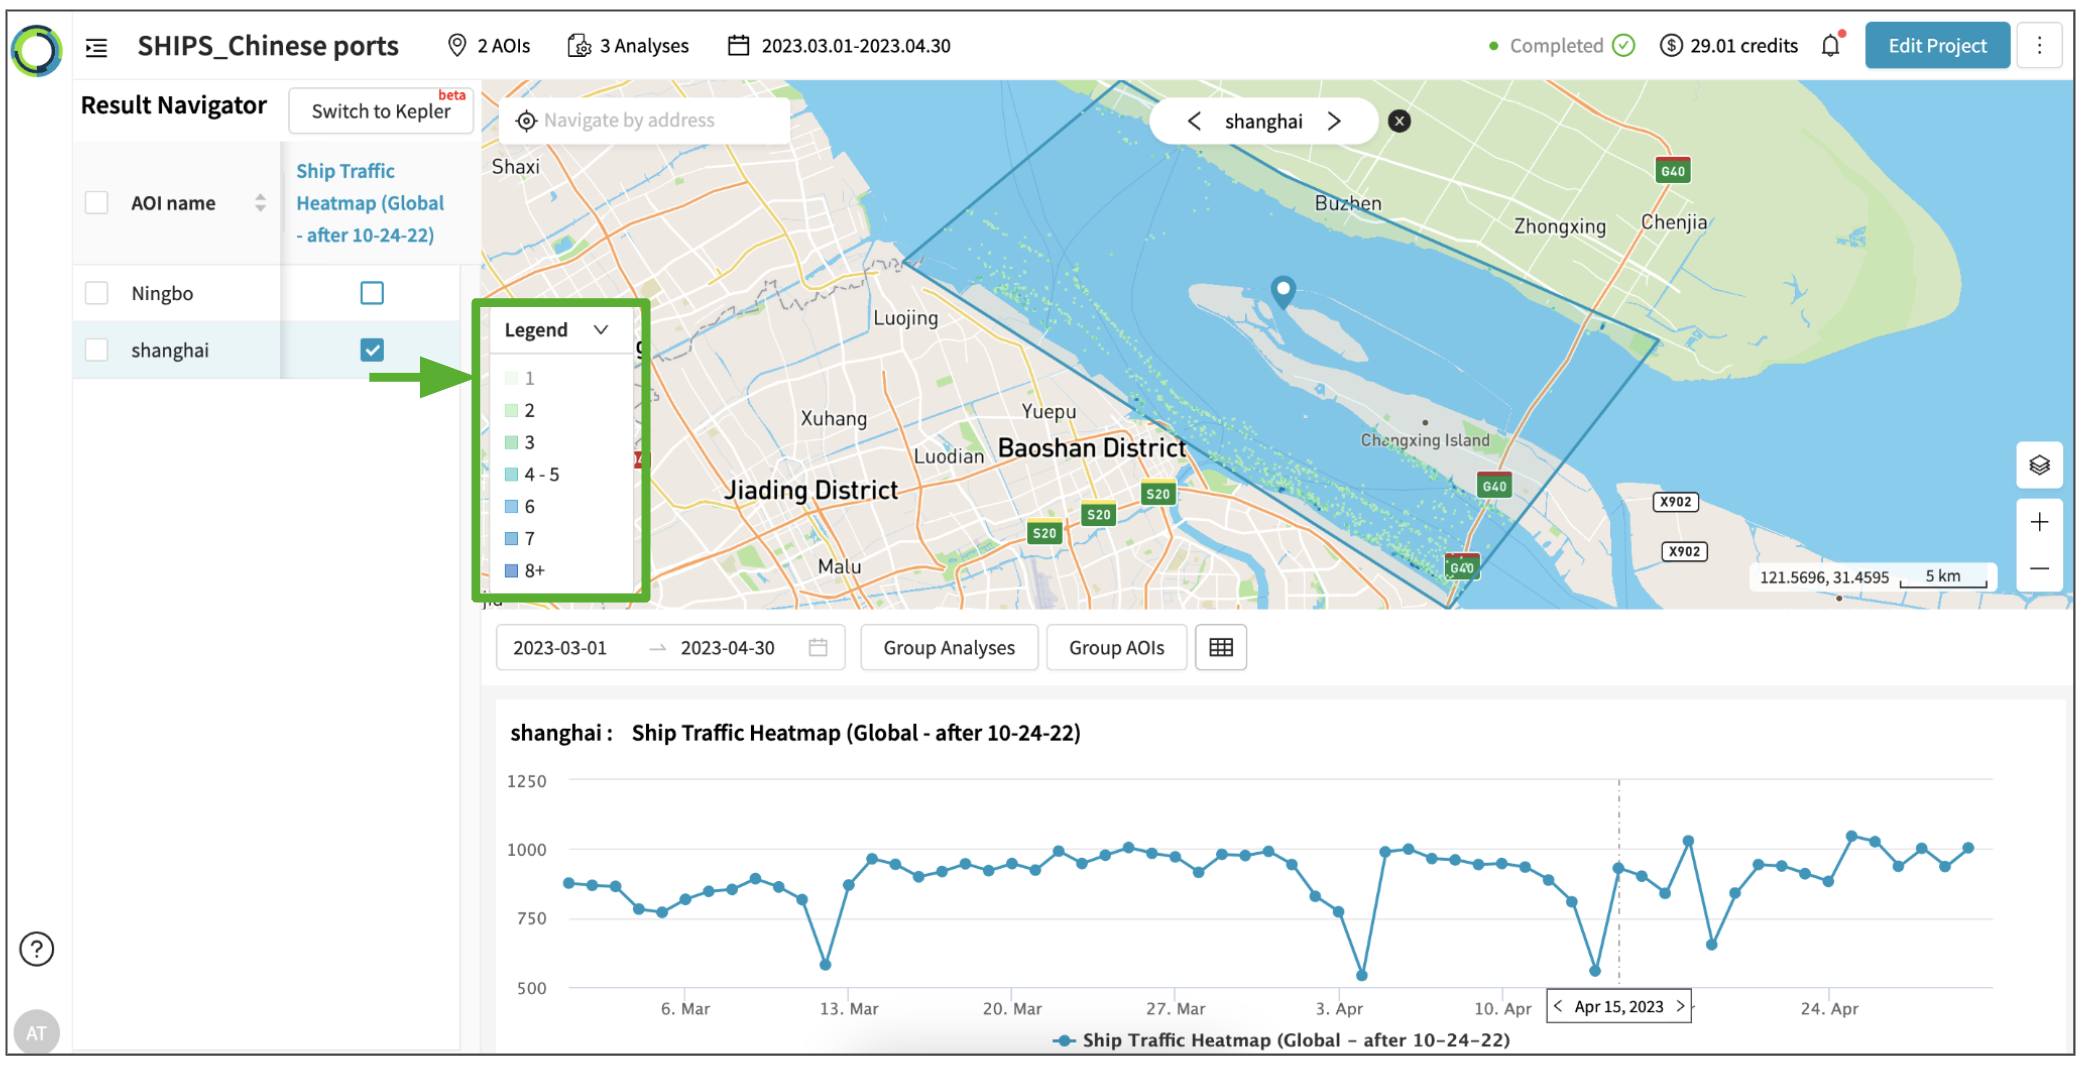
- Show/hide the heatmap pixel based on the count by clicking on layer names in the legend.
- If necessary, change basemap for the map view by clicking on Basemap toggle in the bottom-right corner.
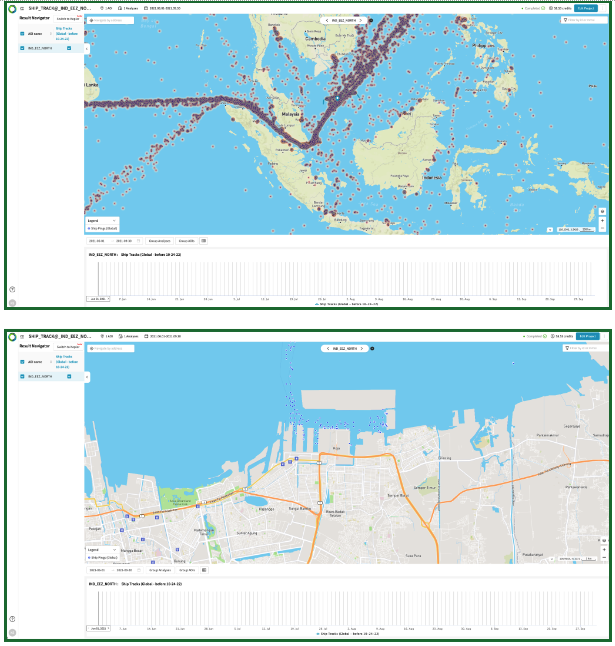
3. Tracks
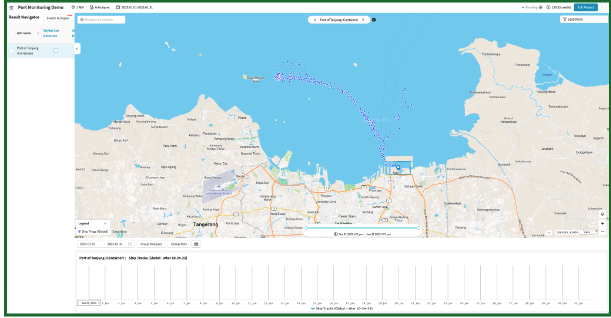
The Track algorithm analyzes your AOIs to identify where devices are coming from / going to. In essence, it looks for devices that appear at your AOI, and traces their movements in aggregate within a customizable window before/after the devices are at the AOI.
The result will be individual ping level for ship and airplane traffic; you may have to zoom into the map to see every ping as the ping get clustered by zooming out.
*For phone track analysis, the individual ping level result is unavailable because of privacy protection purposes.
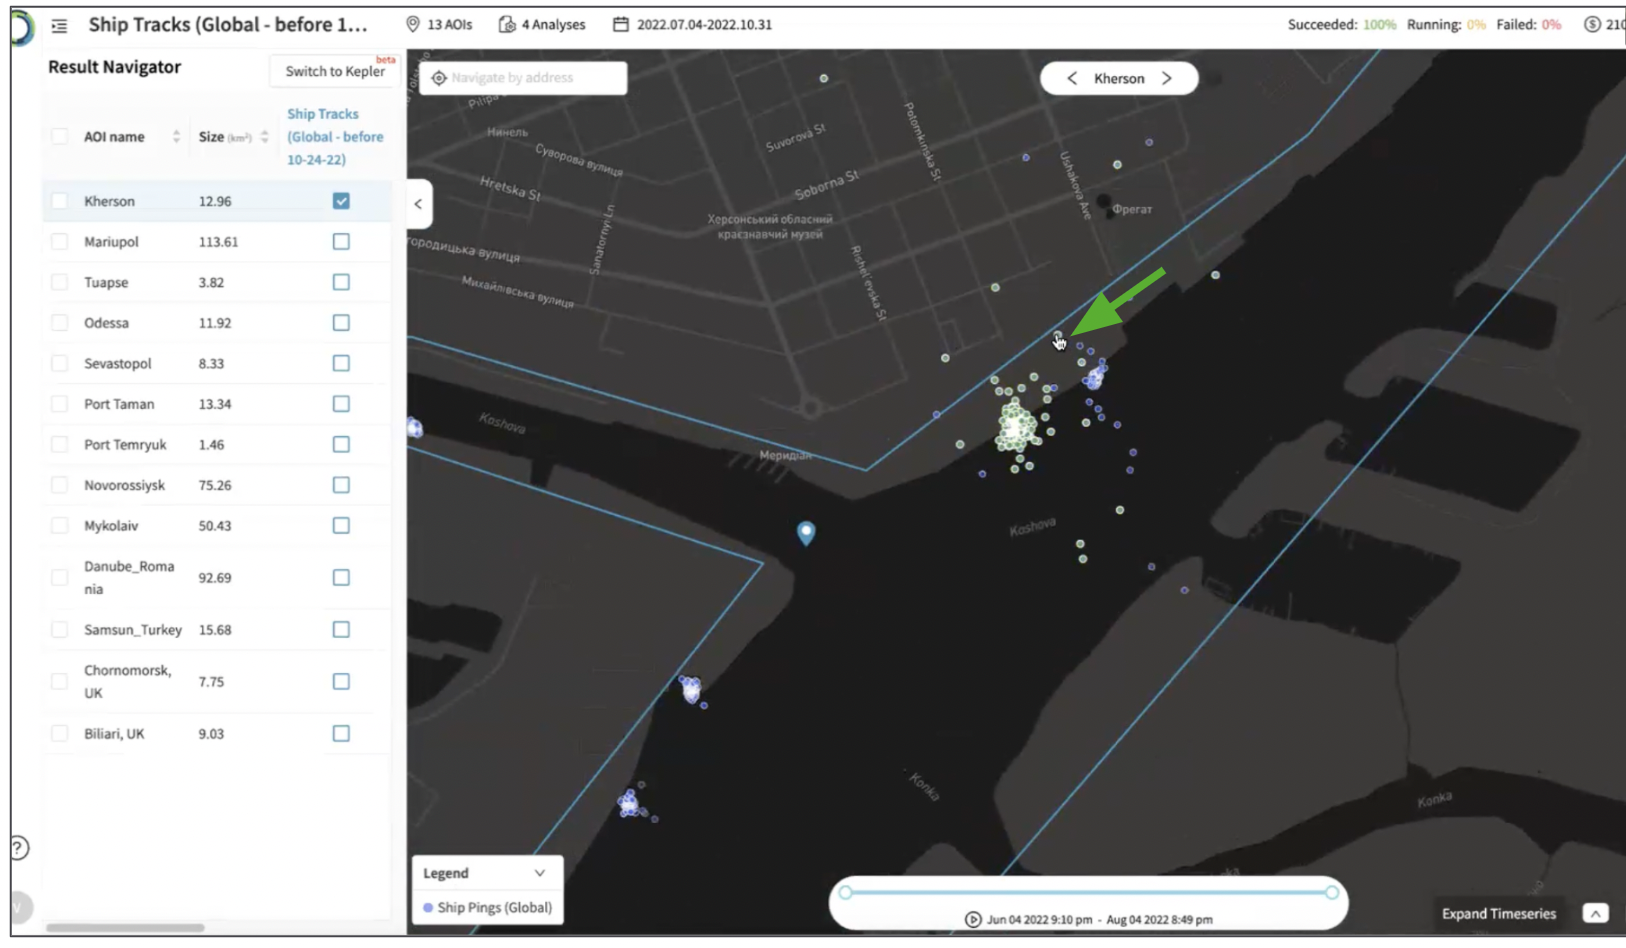
You can “filter” the tracking result into individual ship ID levels (mmsi) in the following two ways:
- Click on the ping that you want to see the track
As below screenshot, the track of the selected ship will show in a different color (green).
If you only want to show the track of the selected ship on the map, see #2.
- Find the mmsi ID by clicking one of the pings in the track result and searching in the upper right search box, pr simply search mmsi ID into the upper right search box
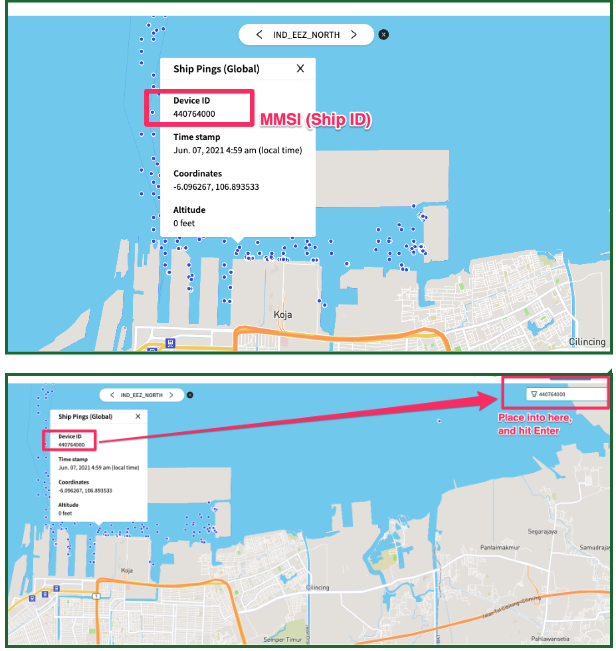
By doing so, you will be able to “only” see track of particular ships. In below the example, the filtered track result shows only the track of the ship that entered Jakarta port on June 07, 2023.
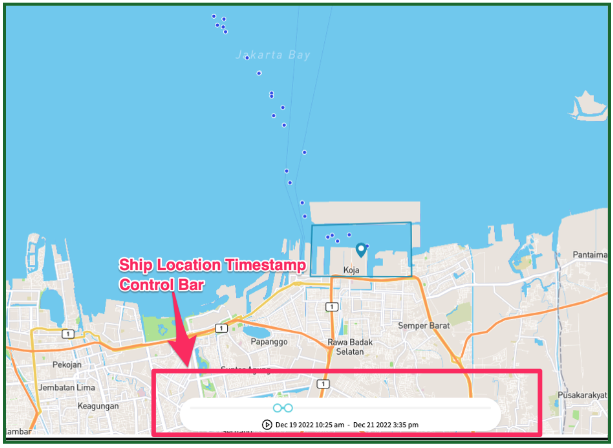
Finally, you will also be able to filter the time of the ship location by using the highlighted time control bar. If you click the “play icon”, you will able to see an animated version of the ship movement.
Updated 6 months ago