
Select Analysis/es
What is an Analysis?Analysis let you configure What you would like to count & measure - such as cars, trucks, or foot traffic. Each analysis is tied to a particular data source, such as a satellite imagery provider - so by choosing an analysis, you are also implicitly making a choice of data source.
This is a big update as compared to GO. Now, you will be able to
- Add multiple analyses to your project without having to duplicate and create multiple copies of your project
- Option to select a predefined analysis (with preset parameters) or customized analysis (with edited parameters)
Selecting the Analysis/es consists of following three steps.
1. Open the Analysis Library
What is the Analysis LibraryThe Analysis Library is a menu of potential methods of analyzing geospatial data in Elements.
As opposed to constructing a complex set of parameters for a project, you can simply select the one(s) you think could answer your question.
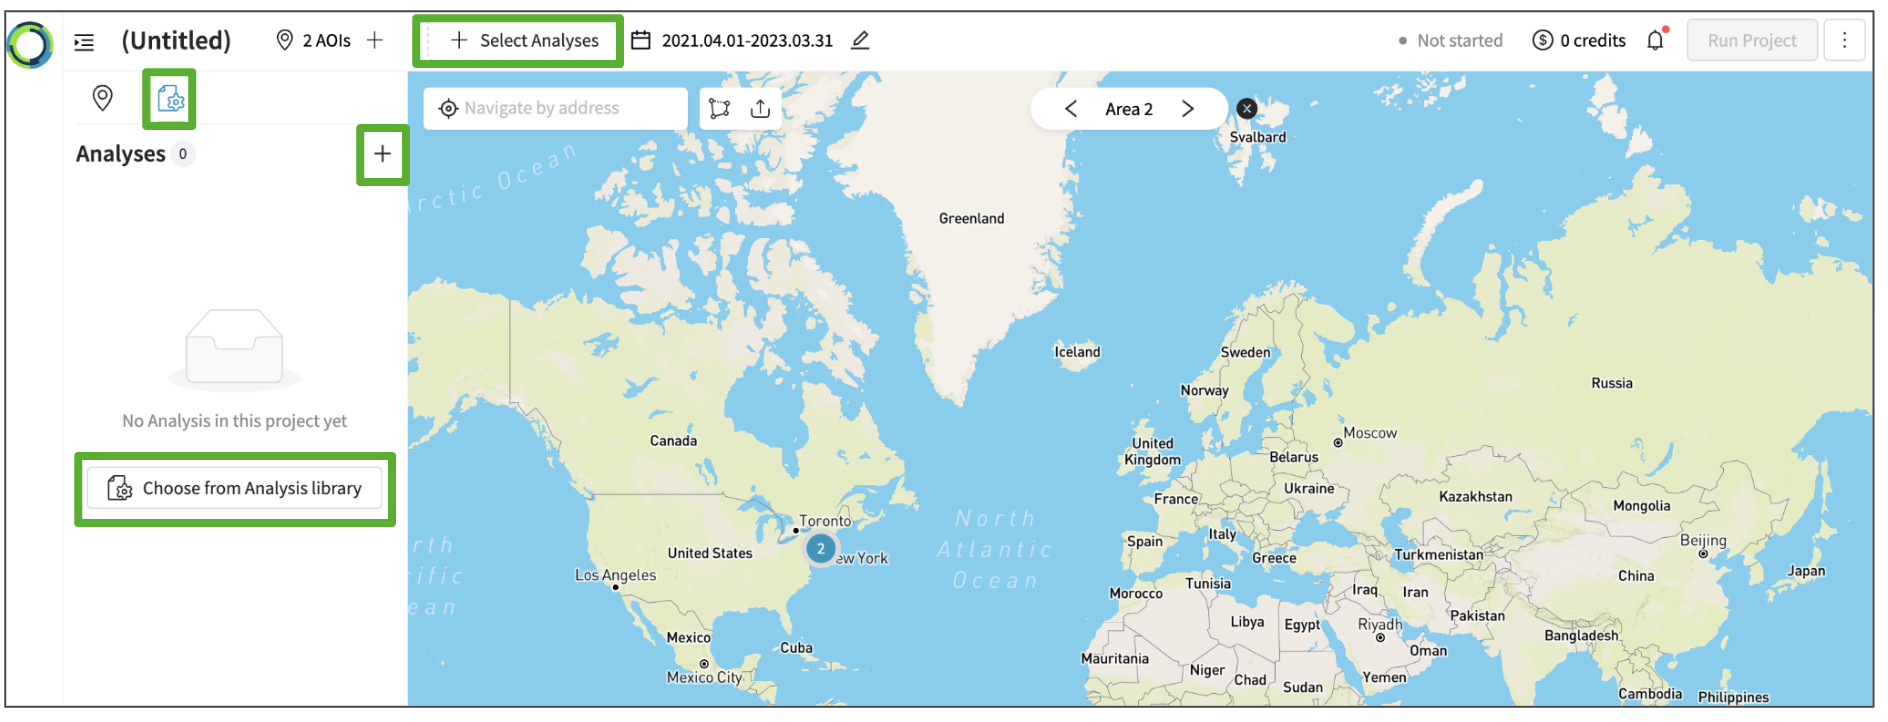
Please select one of the following 'Select Analysis' options :
- Top Panel '+ Select Analysis'
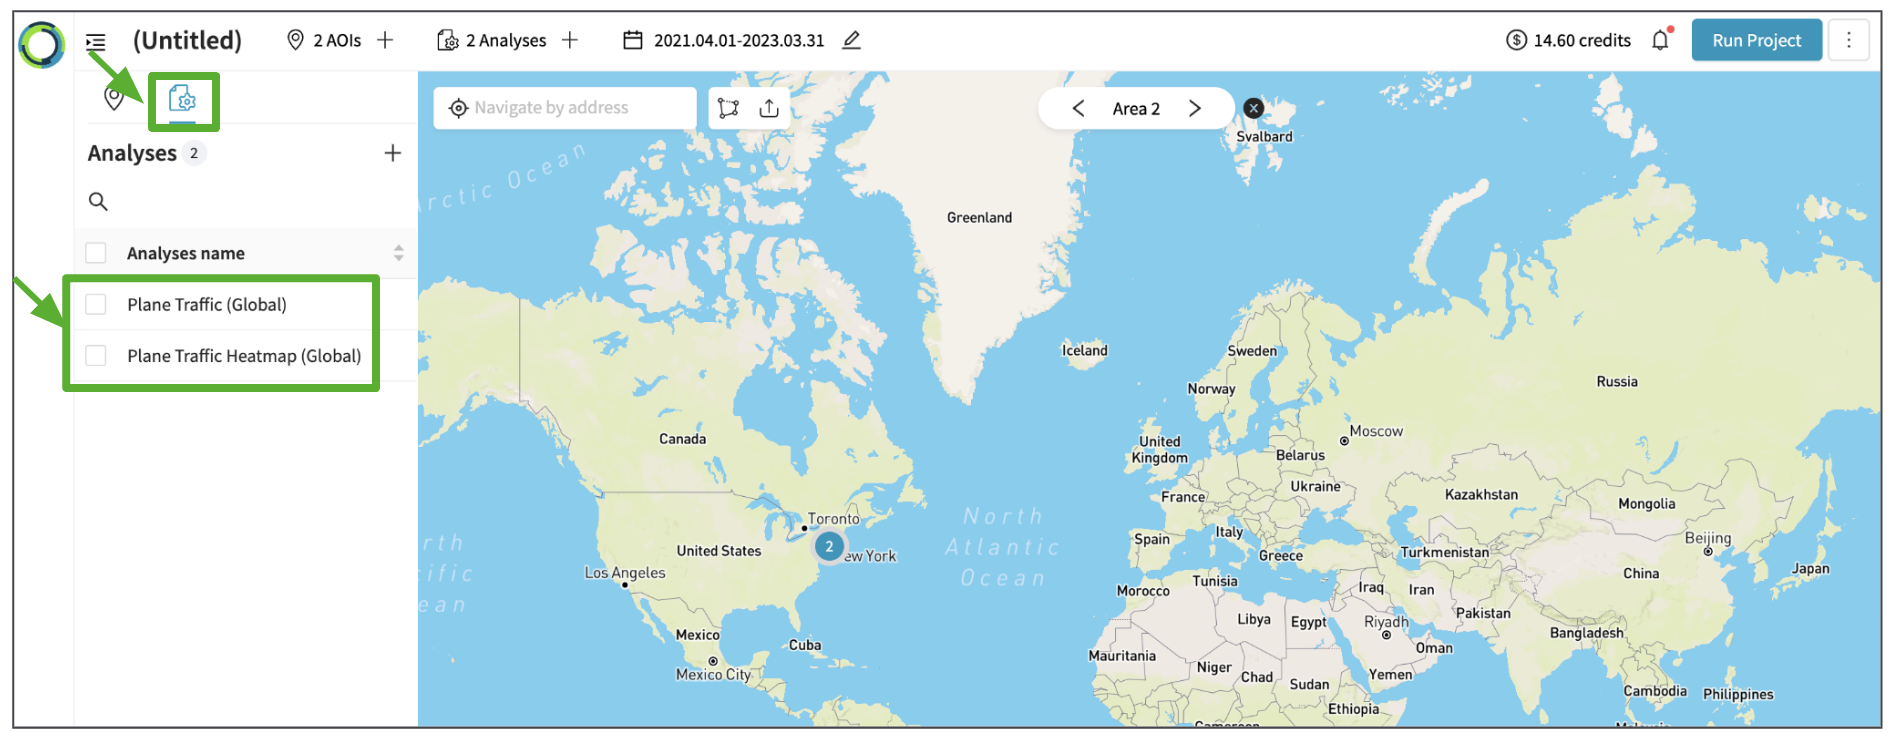
- Left Panel - click on the analysis icon - click '+'
- Left Panel - click on the analysis icon -'Choose from Analysis Library'
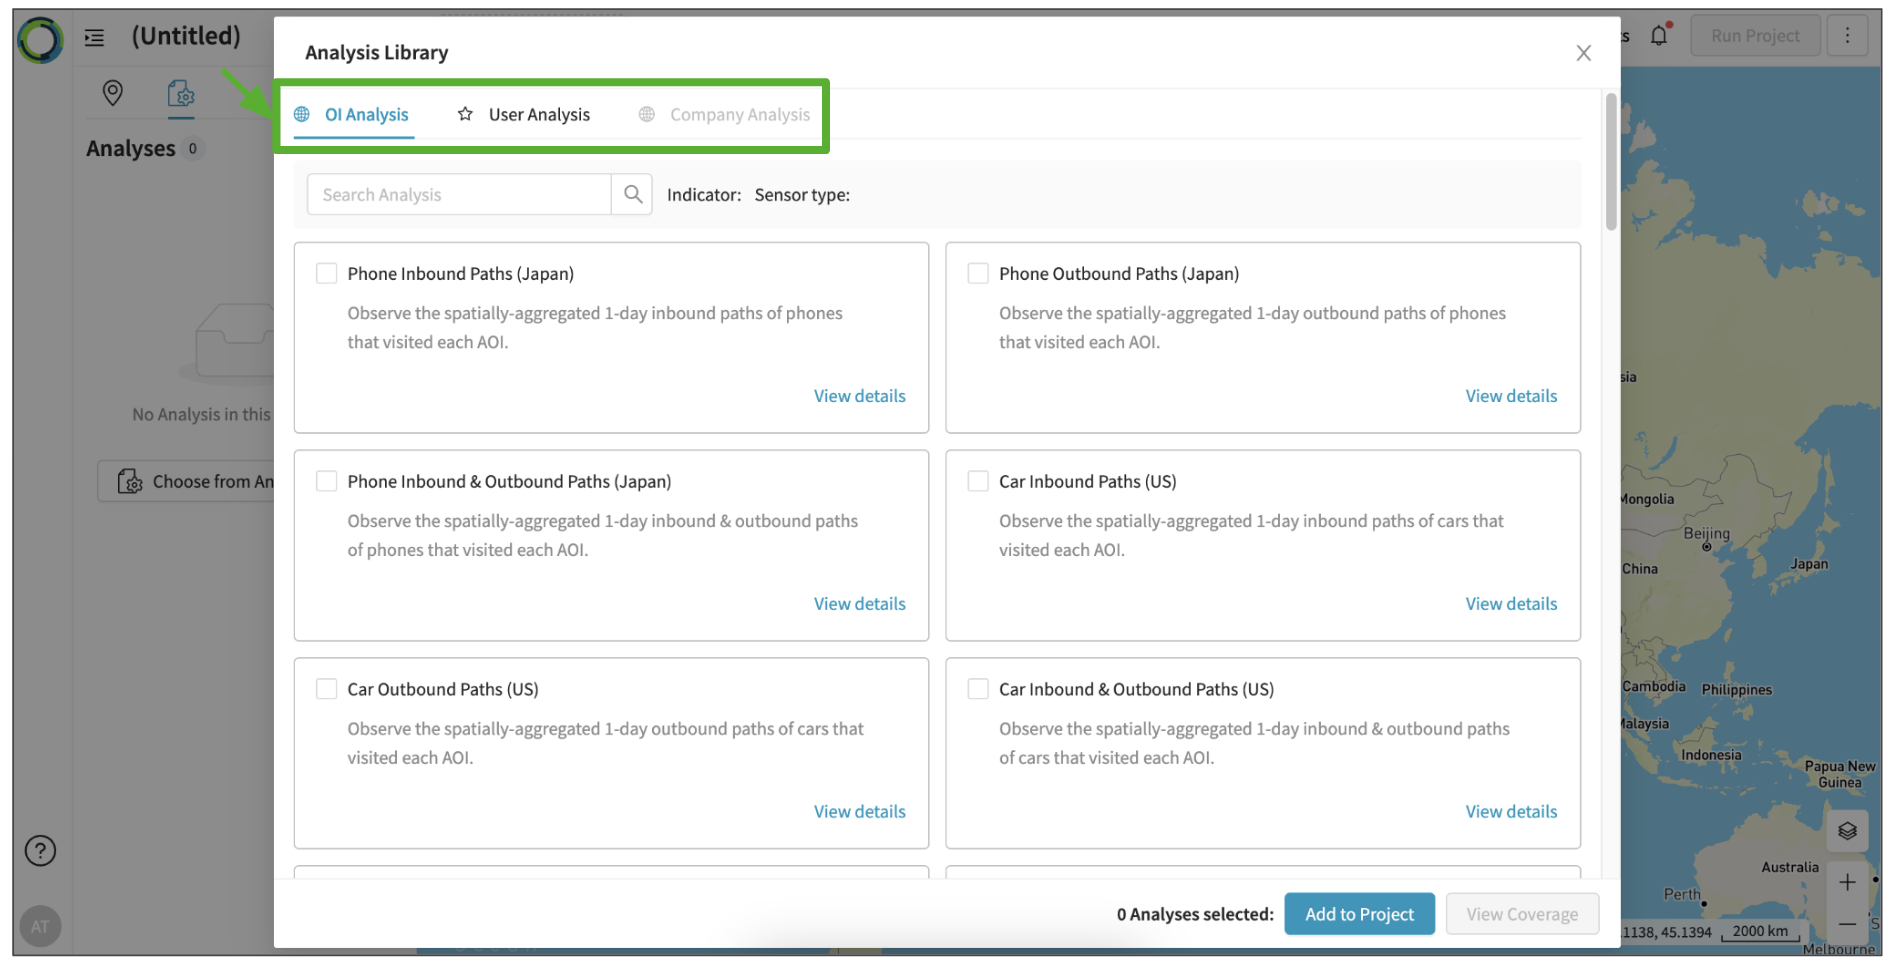
2. Select one or more Analyses
You can add one or more Analysis/es from the following libraries:
- OI Analysis : this displays the standard and globally available Analysis cards. These analyses have pre-defined algorithm parameters. This will help you as a user to not worry about the right selection of the parameters and simply add the analysis/es to your project. Please find details in the Data Source and Analysis Overview section.
- User Analysis : this displays Analysis with user defined parameters and accessible only for you as a user.
- Company Analysis : analysis available for all users within an organization - coming soon!
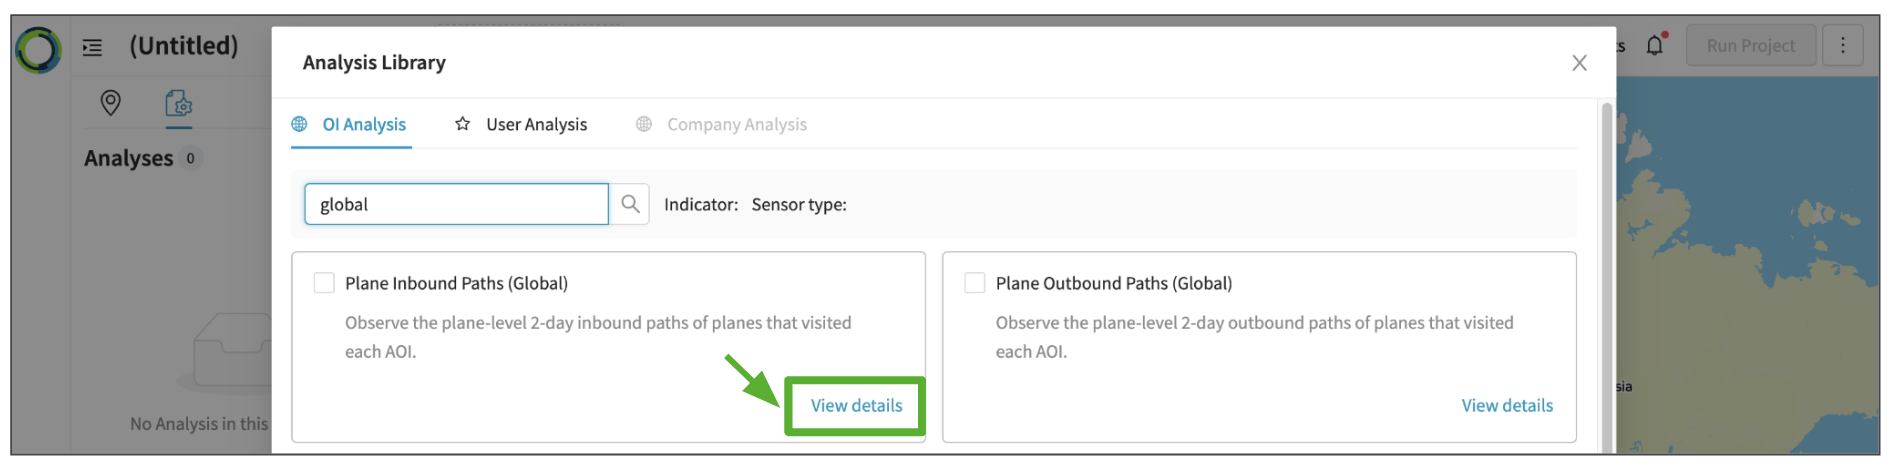
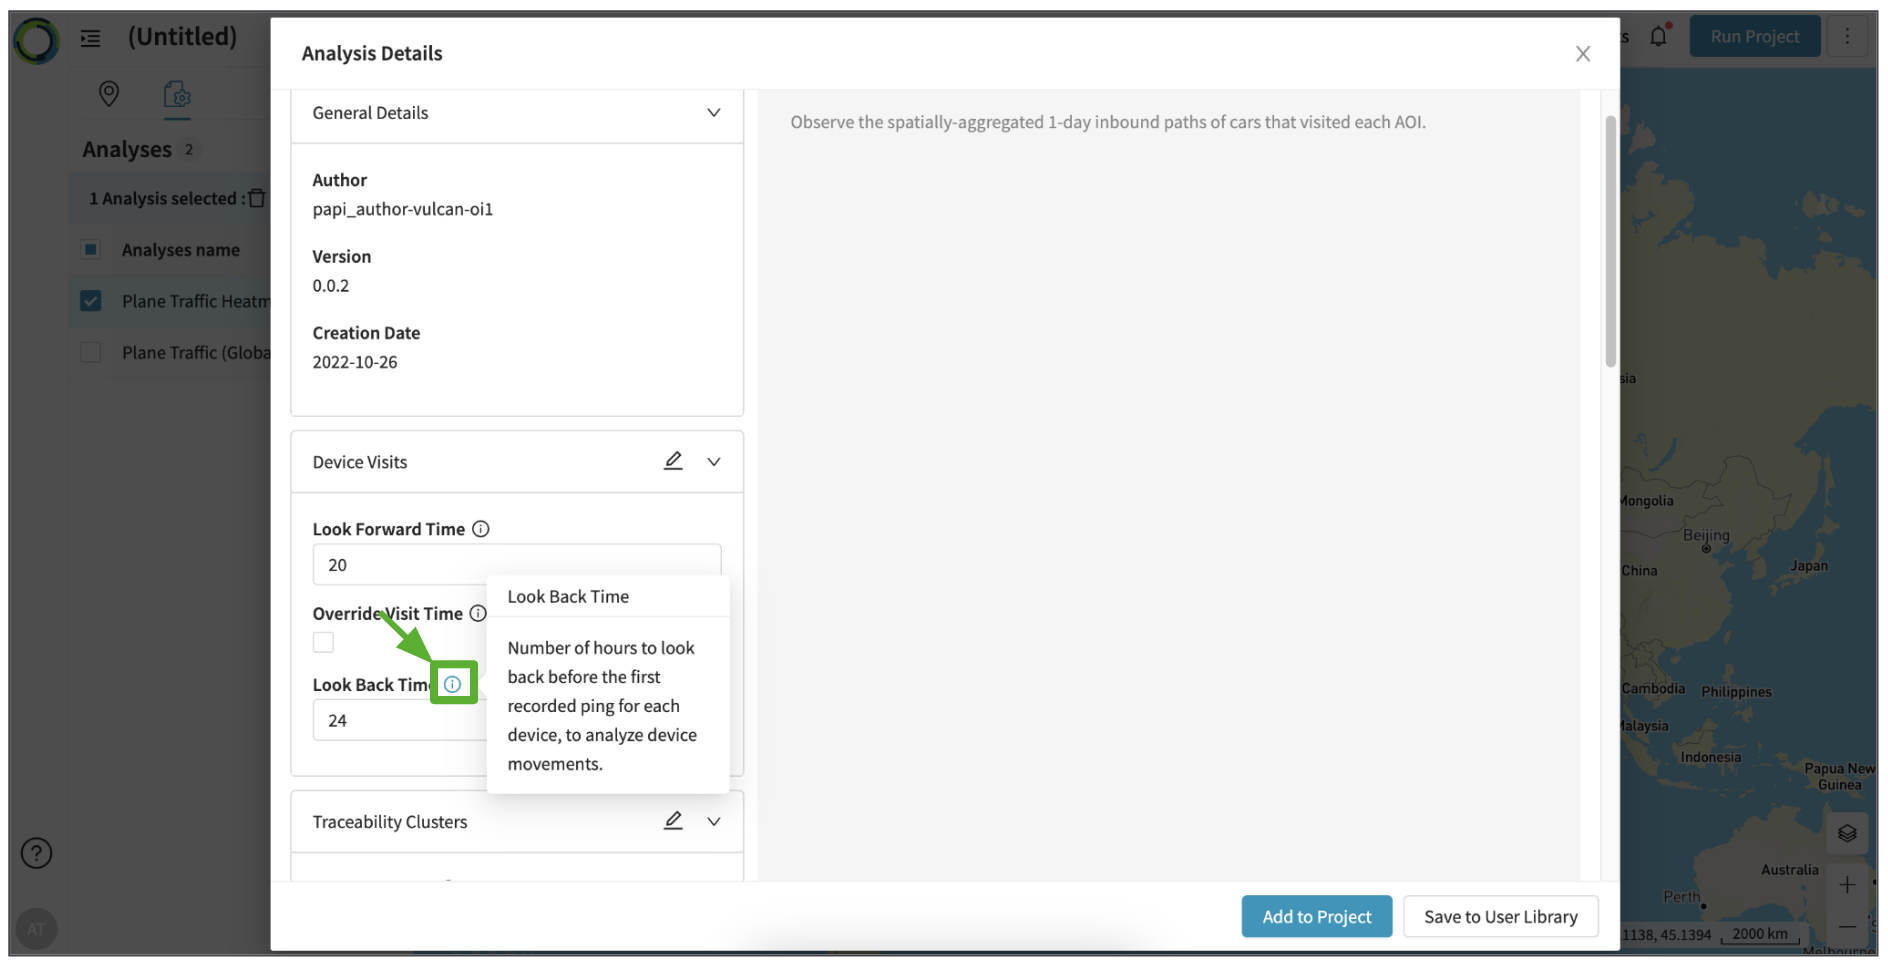
2-1. View details of the Analysis
Before selecting the Analysis you can look into the details of the project and/or edit the parameters. (To edit the parameters, please see below section 3. )
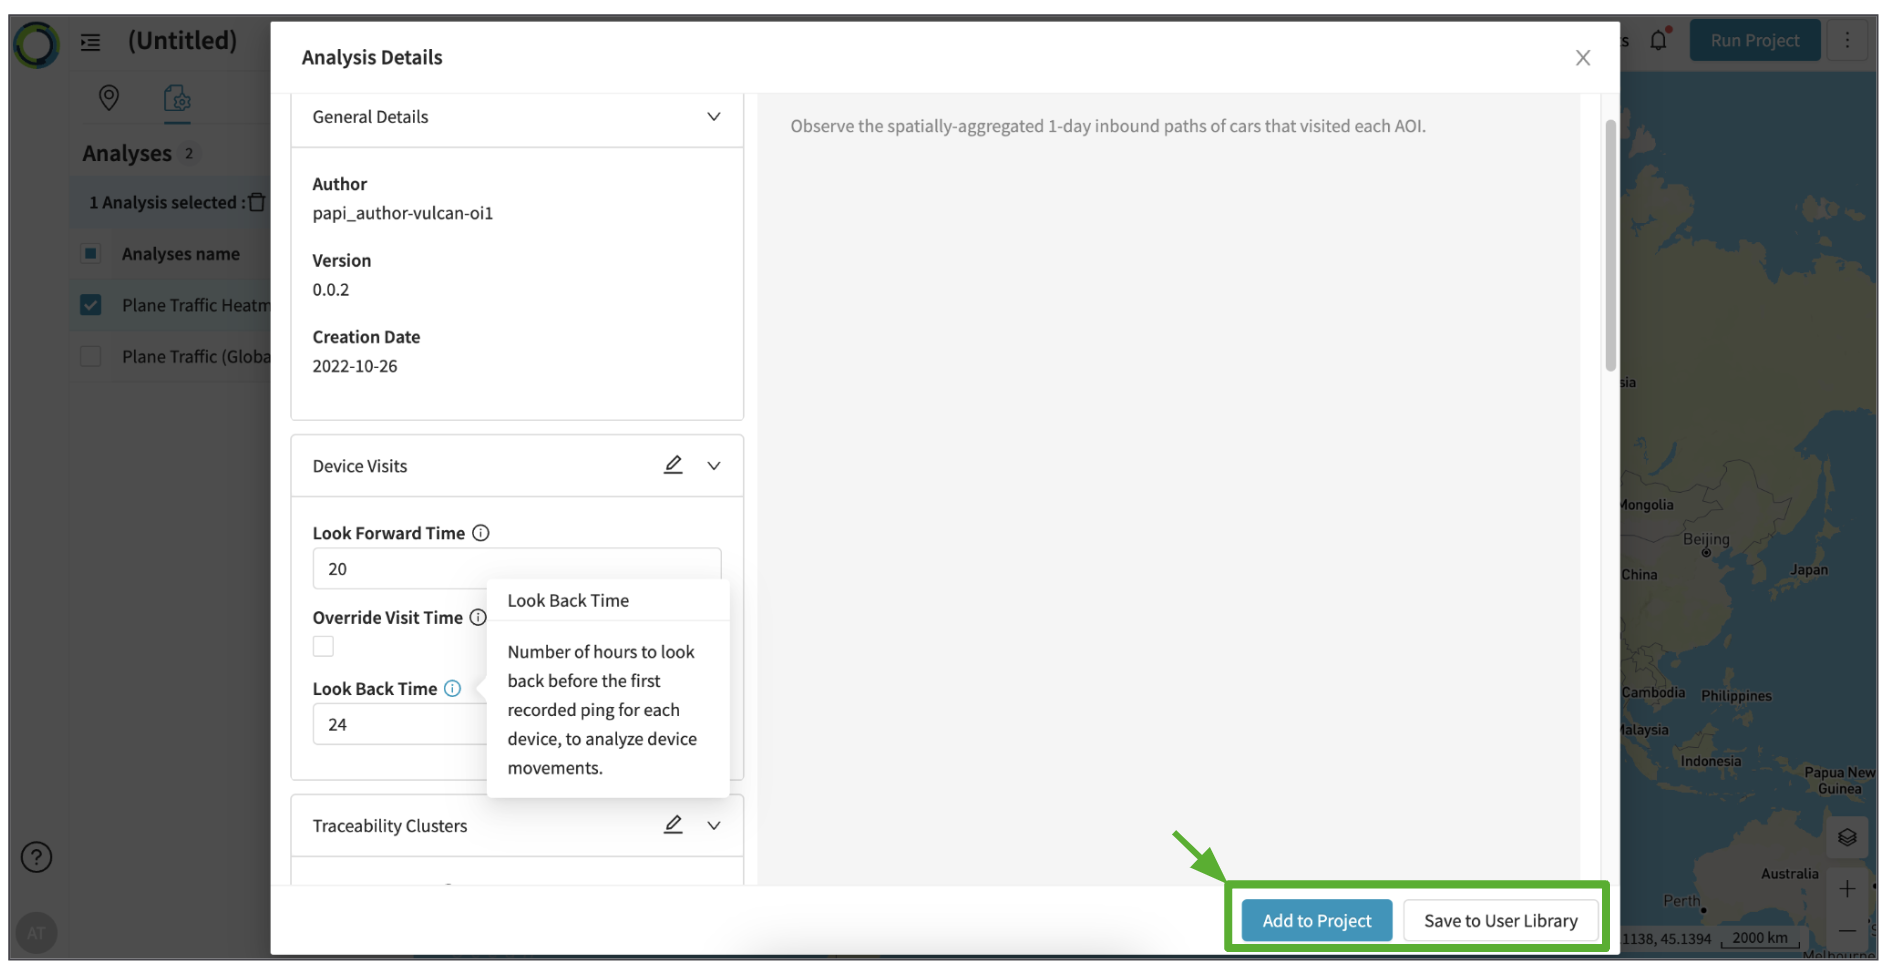
2-2. Add analysis/es to your project
If all details of the Analysis/es looks good, select the checkbox of the Analysis to be used for the project and click 'Add to Project'.
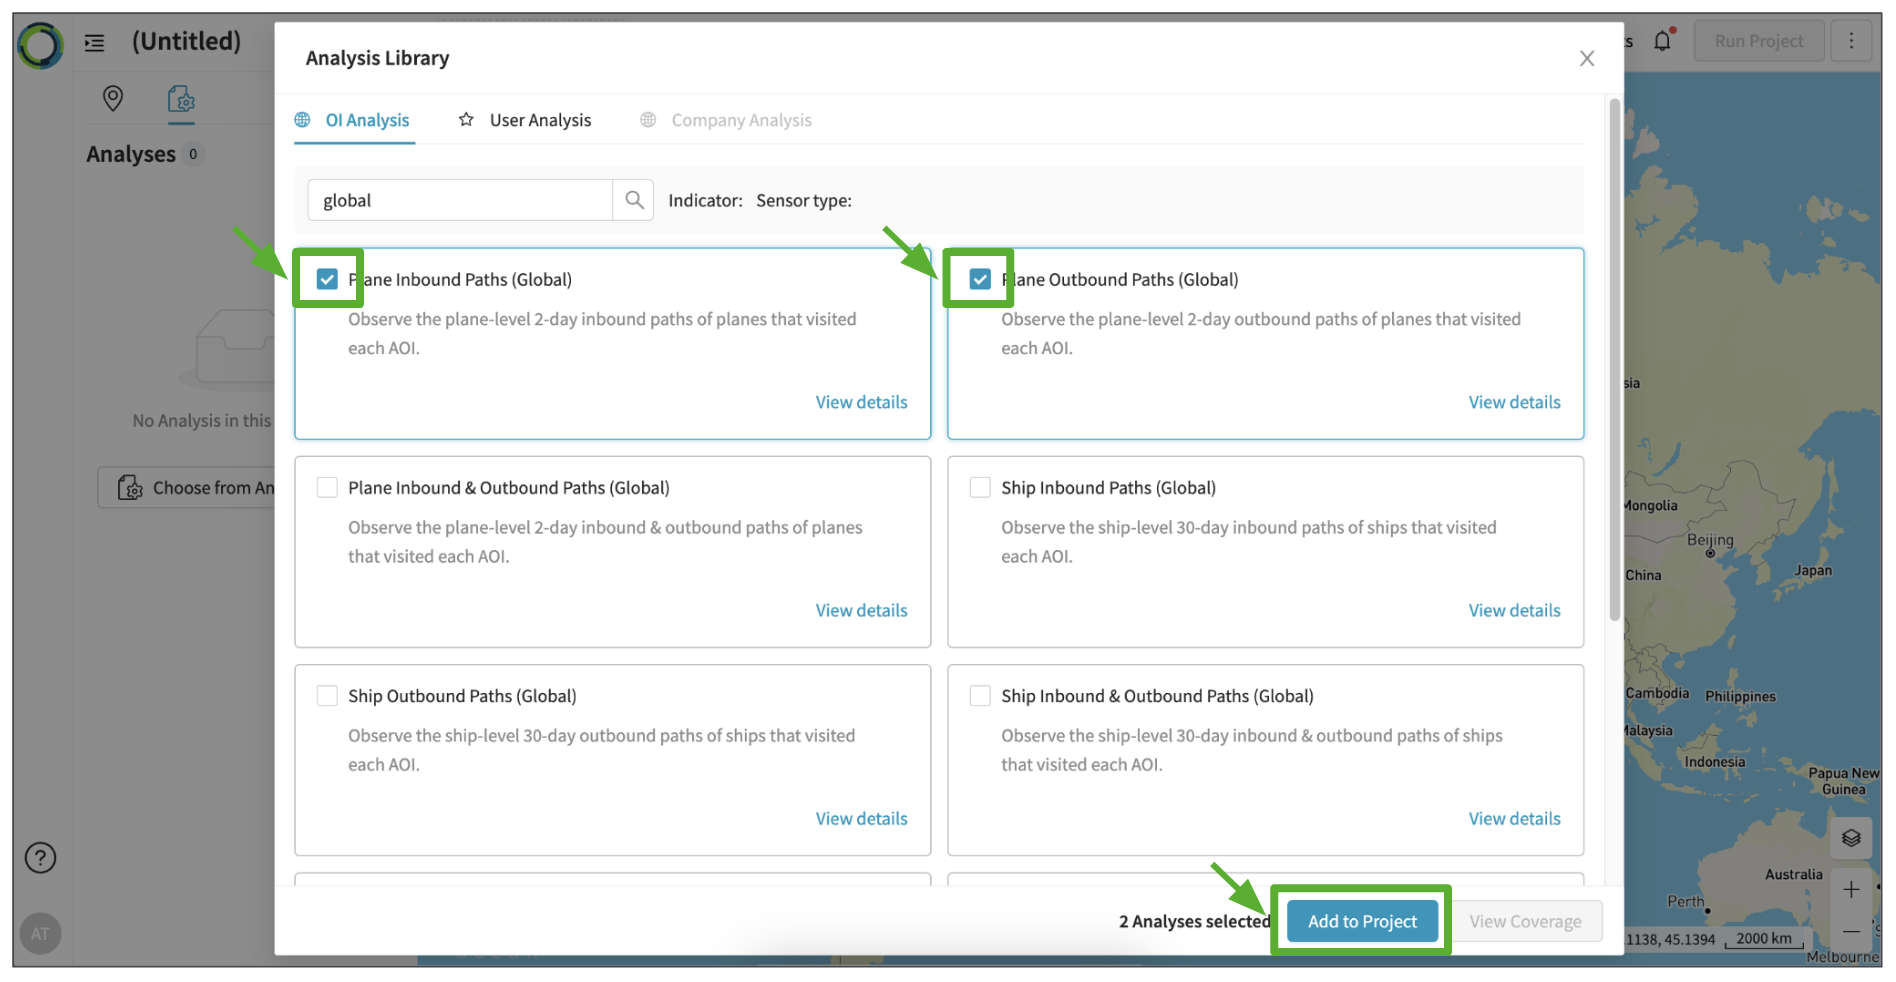
The analysis/es added to your project will be displayed in the left panel.
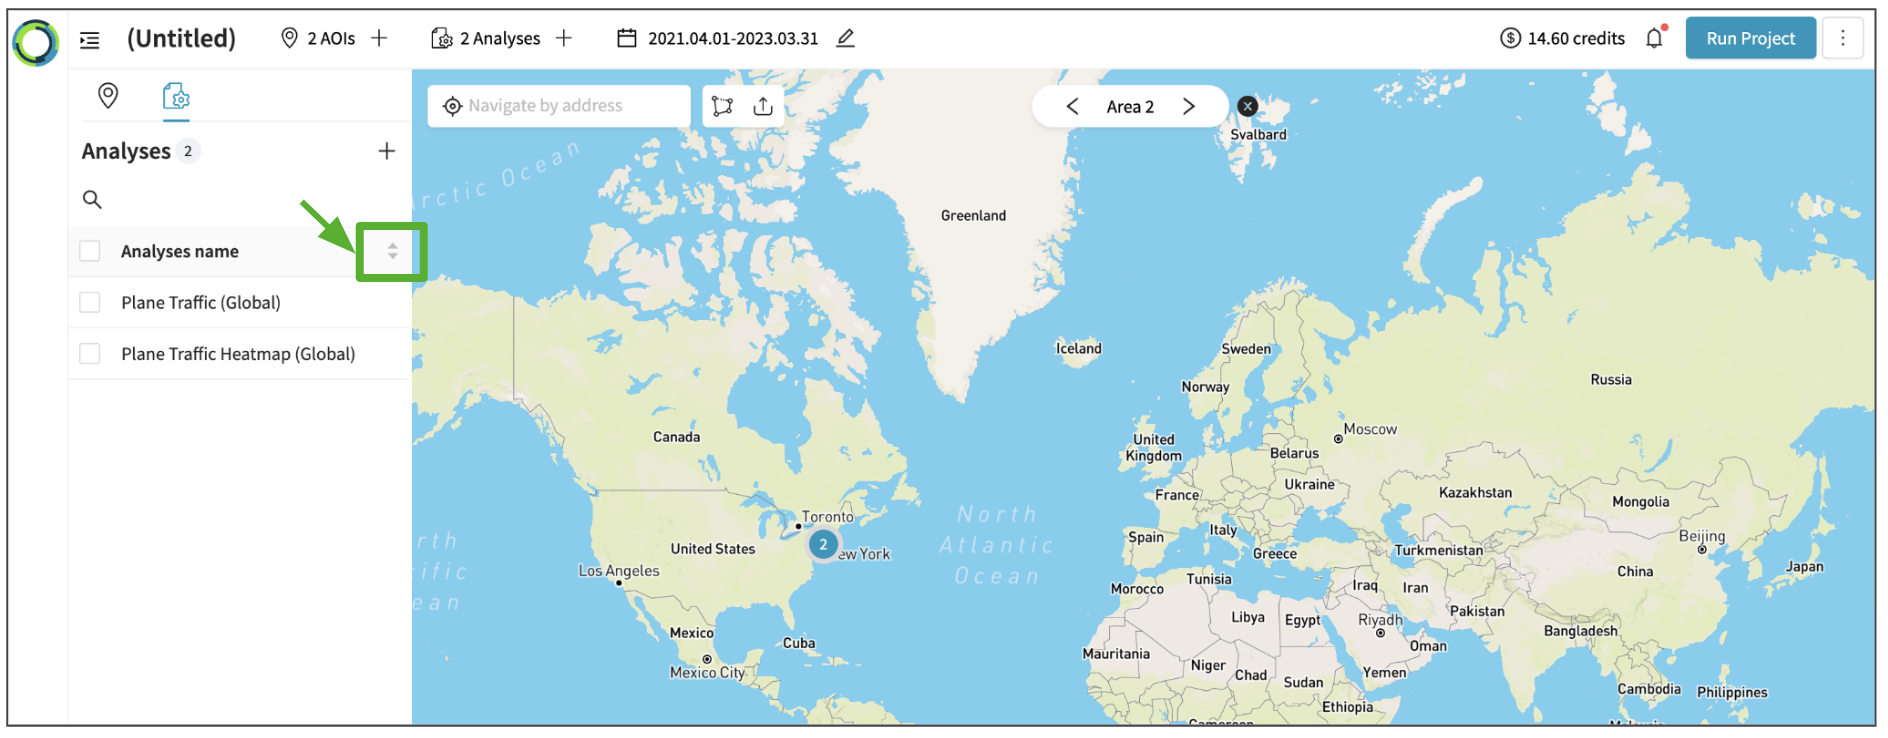
2-3. Sort analyses
You can sort the analyses in an alphabetical order from ascending or descending manner by clicking the arrow icon.
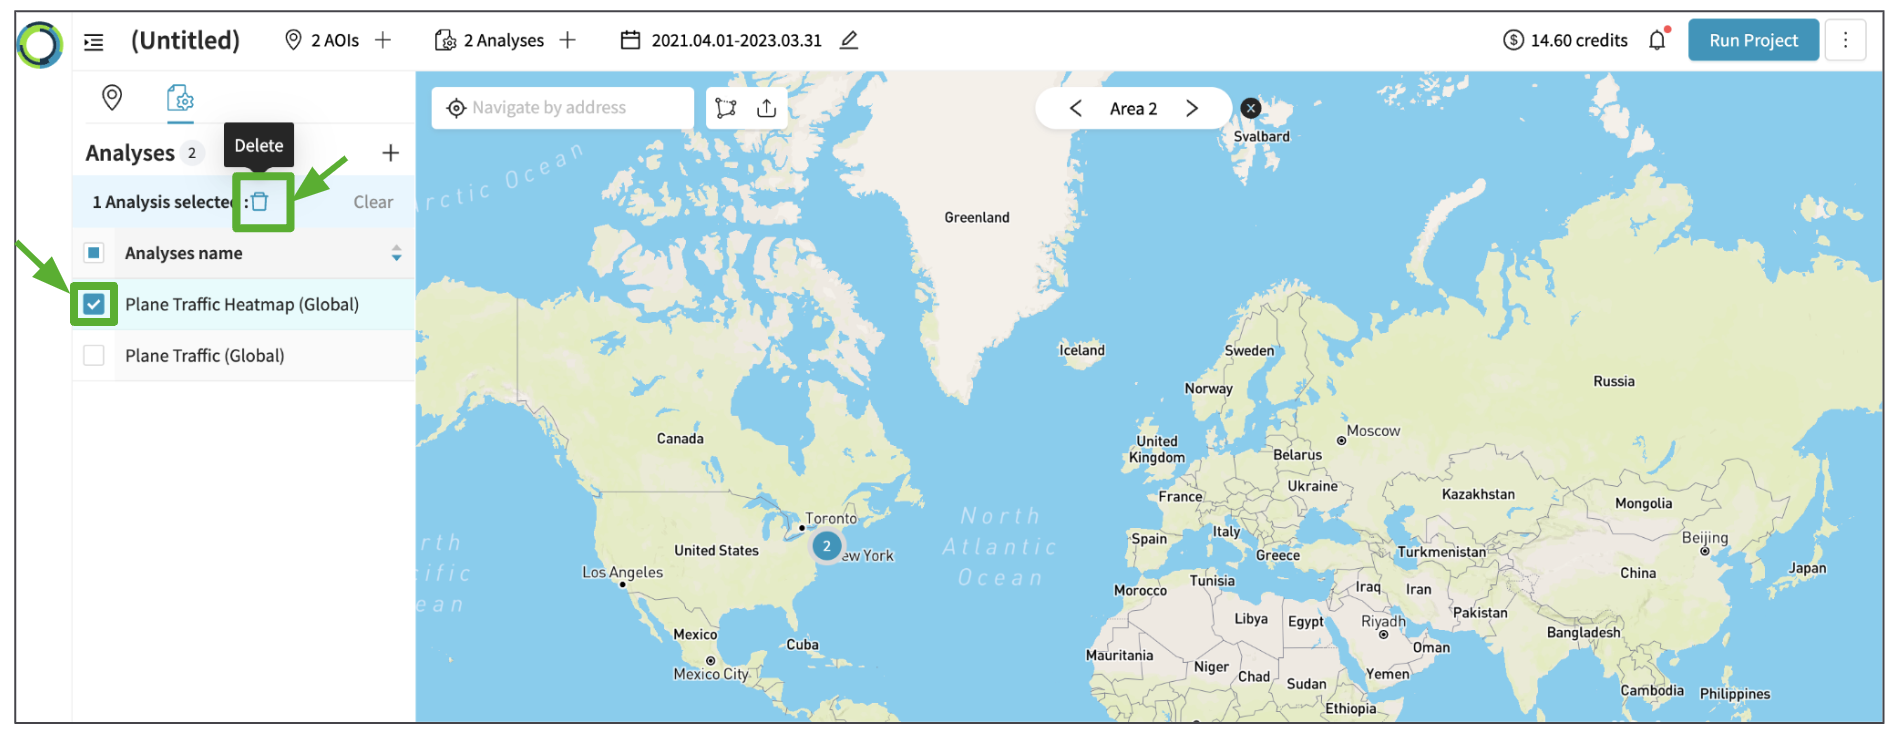
2-4. Delete analysis/es
You can select the checkbox of the analysis/es and click the 'delete' icon to delete it from your project before you decide to run the analysis.
3. Edit parameters
What are parameters?Parameters allow you to configure more advanced settings for How the Analysis should work.
Each Analysis has a set of configurable parameters, although the defaults should work well for most cases.
Once you open the details of the Analysis, click the pencil icon to start editing the parameters. Click the pencil icon again once the edit is complete.
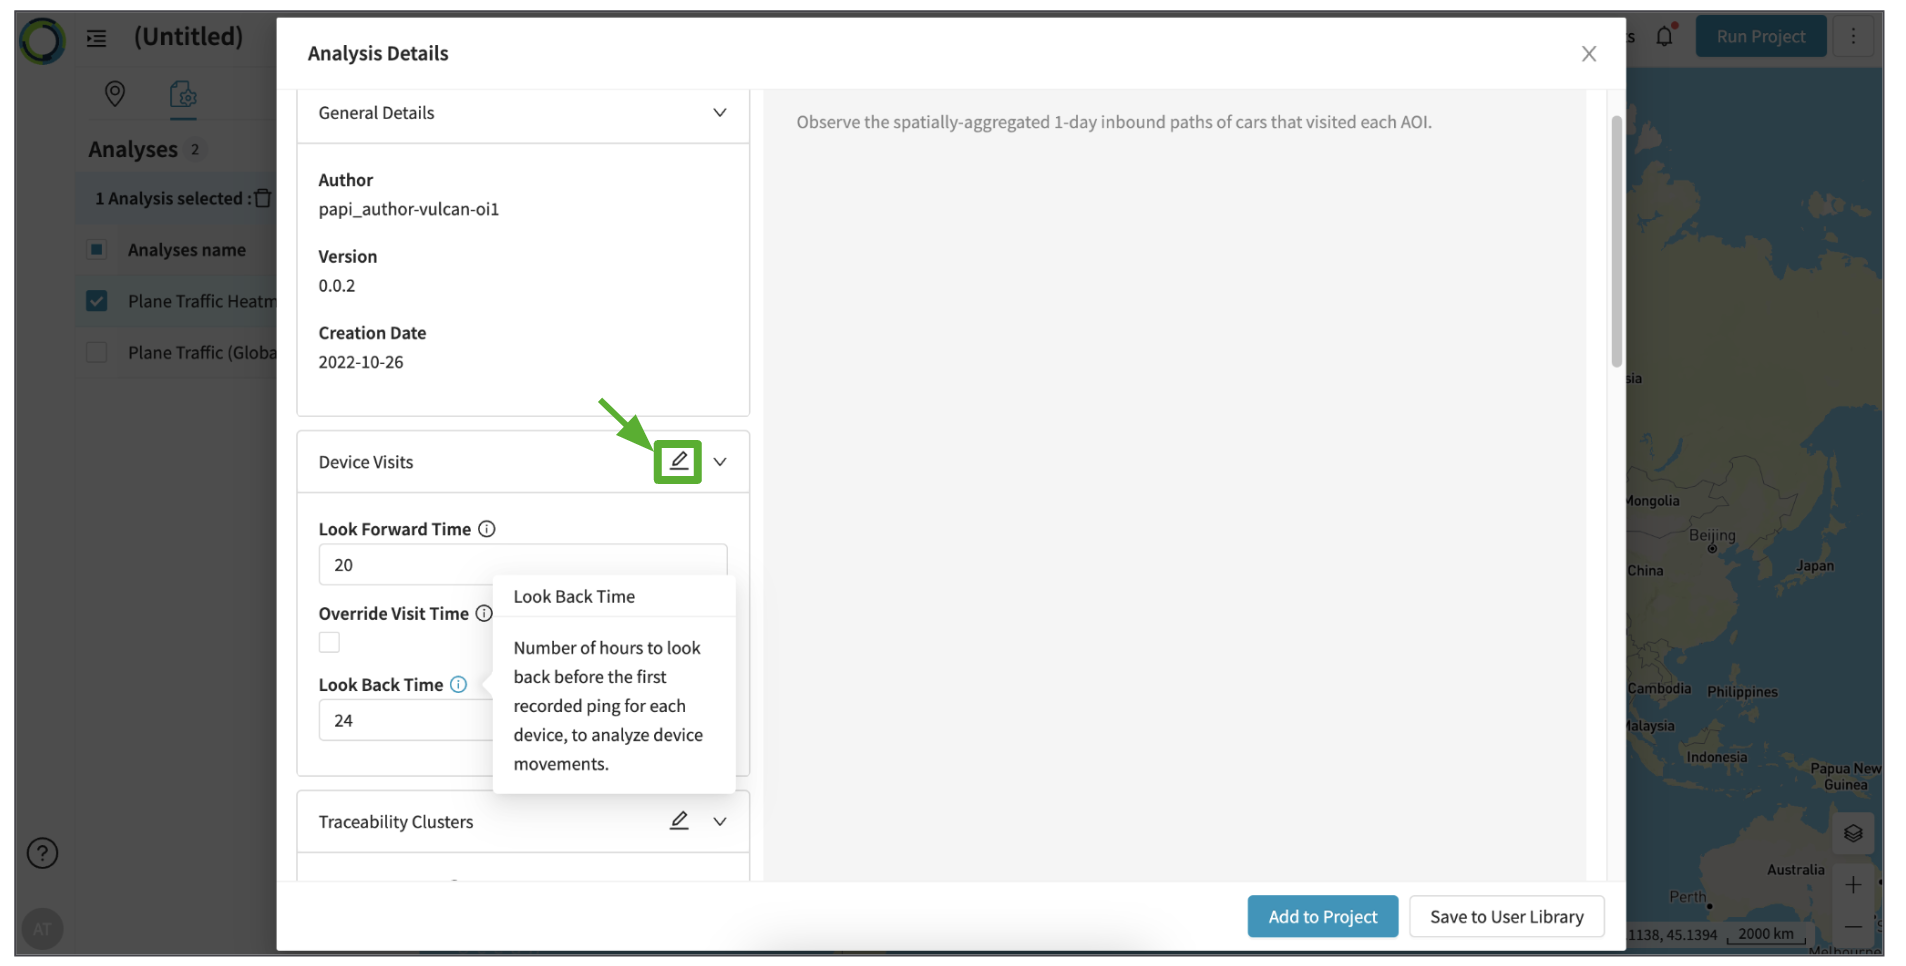
The definition of each parameters are as below: You can also click the information icon on the UI to see the definitions.
-
Parameters for Object Detection and Land Use analysis
- Max Cloud Cover
The maximum percent of the area of the entire scene geometry that can be obscured by clouds.
Cloud filtering at this step is approximate
At this step, Elements has not yet ordered and received the imagery, and so relies on what the satellite imagery providers have calculated as an approximate cloud coverage for the entire satellite image. As such, it is possible that an image with a 70% cloud cover may still be non-cloudy over your AOI.
- Min AOI Coverage The minimum percent of the AOI area that must be covered by the geometry of the scene.
- Max Incidence Angle The maximum angle (in degrees) between the surface normal at the target and the look direction of the satellite sensor.
- Max Cloud Cover
The maximum percent of the area of the entire scene geometry that can be obscured by clouds.
-
Parameters for Geolocation Traffic and Heatmap analysis
- Min Dwell Time Minimum dwell time in minutes required for a ping to be included in unique device count. Default is 0 min. (i.e. all pings are included).
- Max Dwell Time: Maximum dwell time in minutes required for a ping to be included in unique device count. Default is None. (i.e. all pings are included).
- Grid Cell Size for the heatmap Length of the square-shaped grid cells in meters.
-
Parameters for Geolocation Tracks analysis
- Look Forward Time
Number of hours to look forward after the last recorded ping for each device, to analyze device movements.
- Look Back Time Number of hours to look back before the first recorded ping for each device, to analyze device movements.
- Override Visit Time If enabled, set the look back and look forward timestamp to be equal to the start and end of the given observation for all devices.
- Max Horizontal Uncertainty Pings with a reported positional uncertainty greater than this value will be filtered out of the track. If 0, then there is no filtering.
- Max Velocity Window Velocity values are only computed if the time-interval between consecutive pings is less than this value. Default is None.
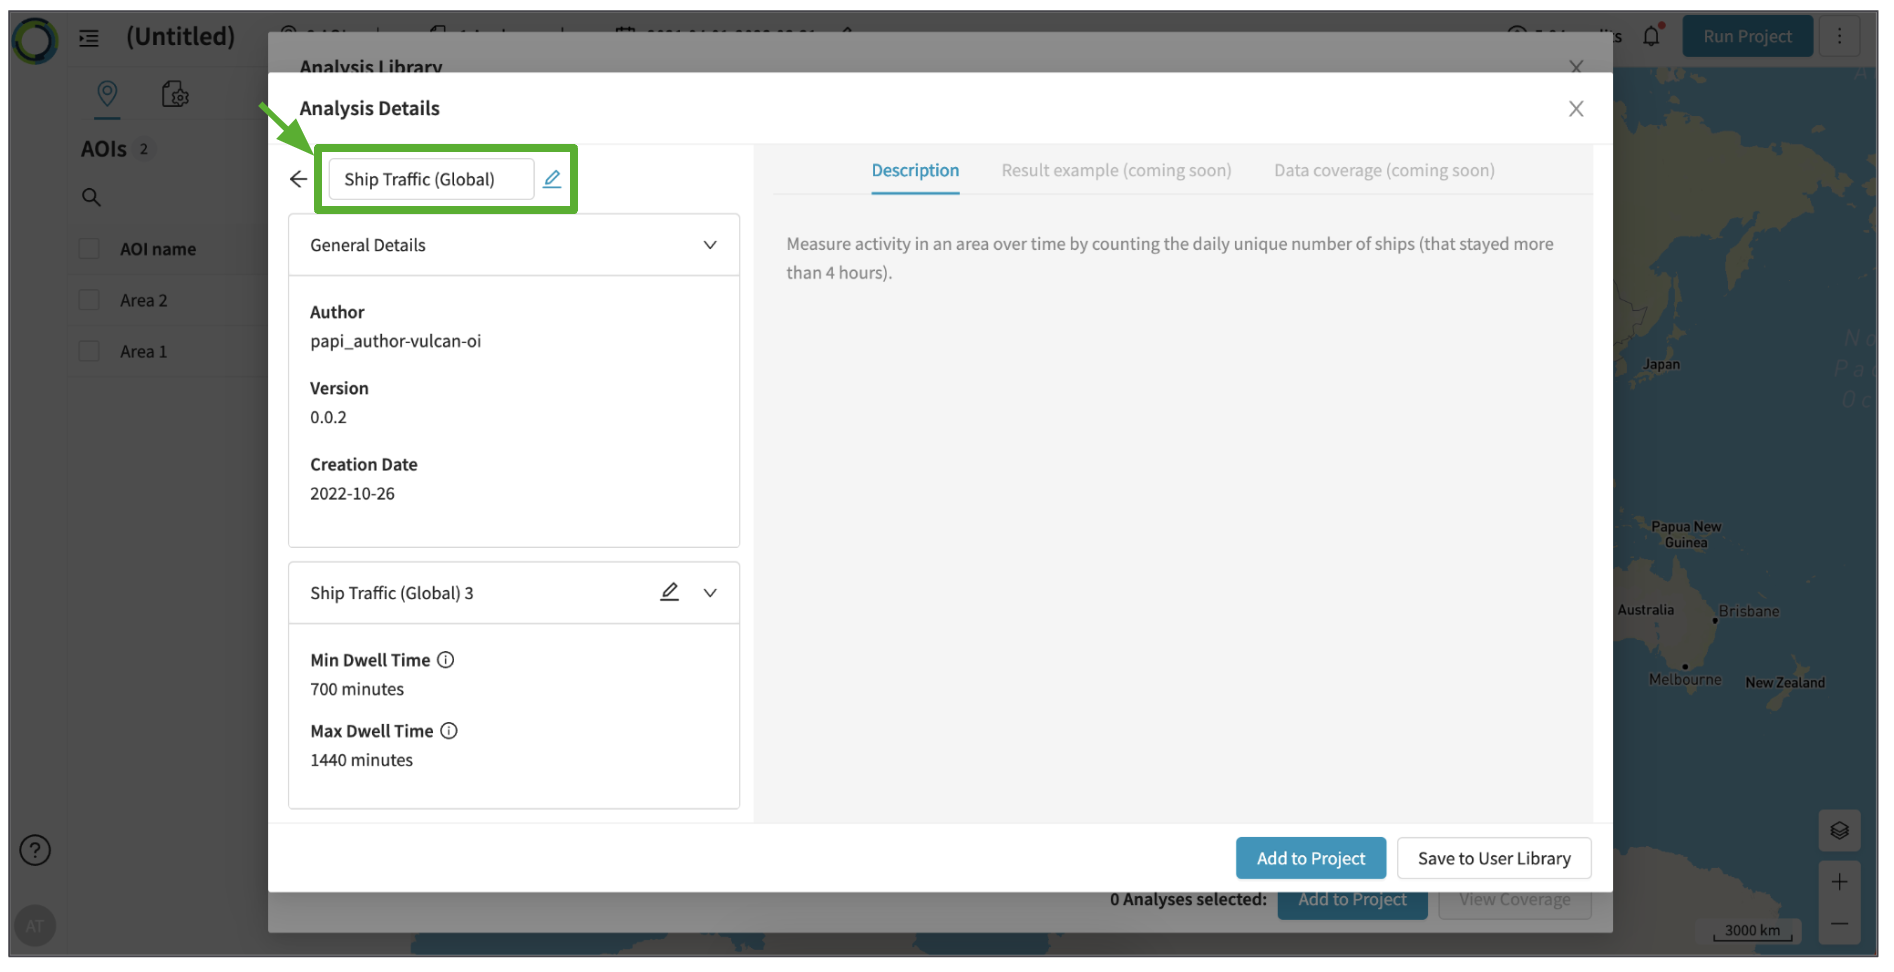
If you are saving the Analysis with your customized parameters to your User Library, make sure to change the name of the Analysis for easier reference in the future. You can change the name by clicking the pencil icon next to the Analysis.
Once you have edited the parameters and the Analysis name, you can directly 'Add to Project' or 'Save to User Library' for future access from the 'User Analysis' library.
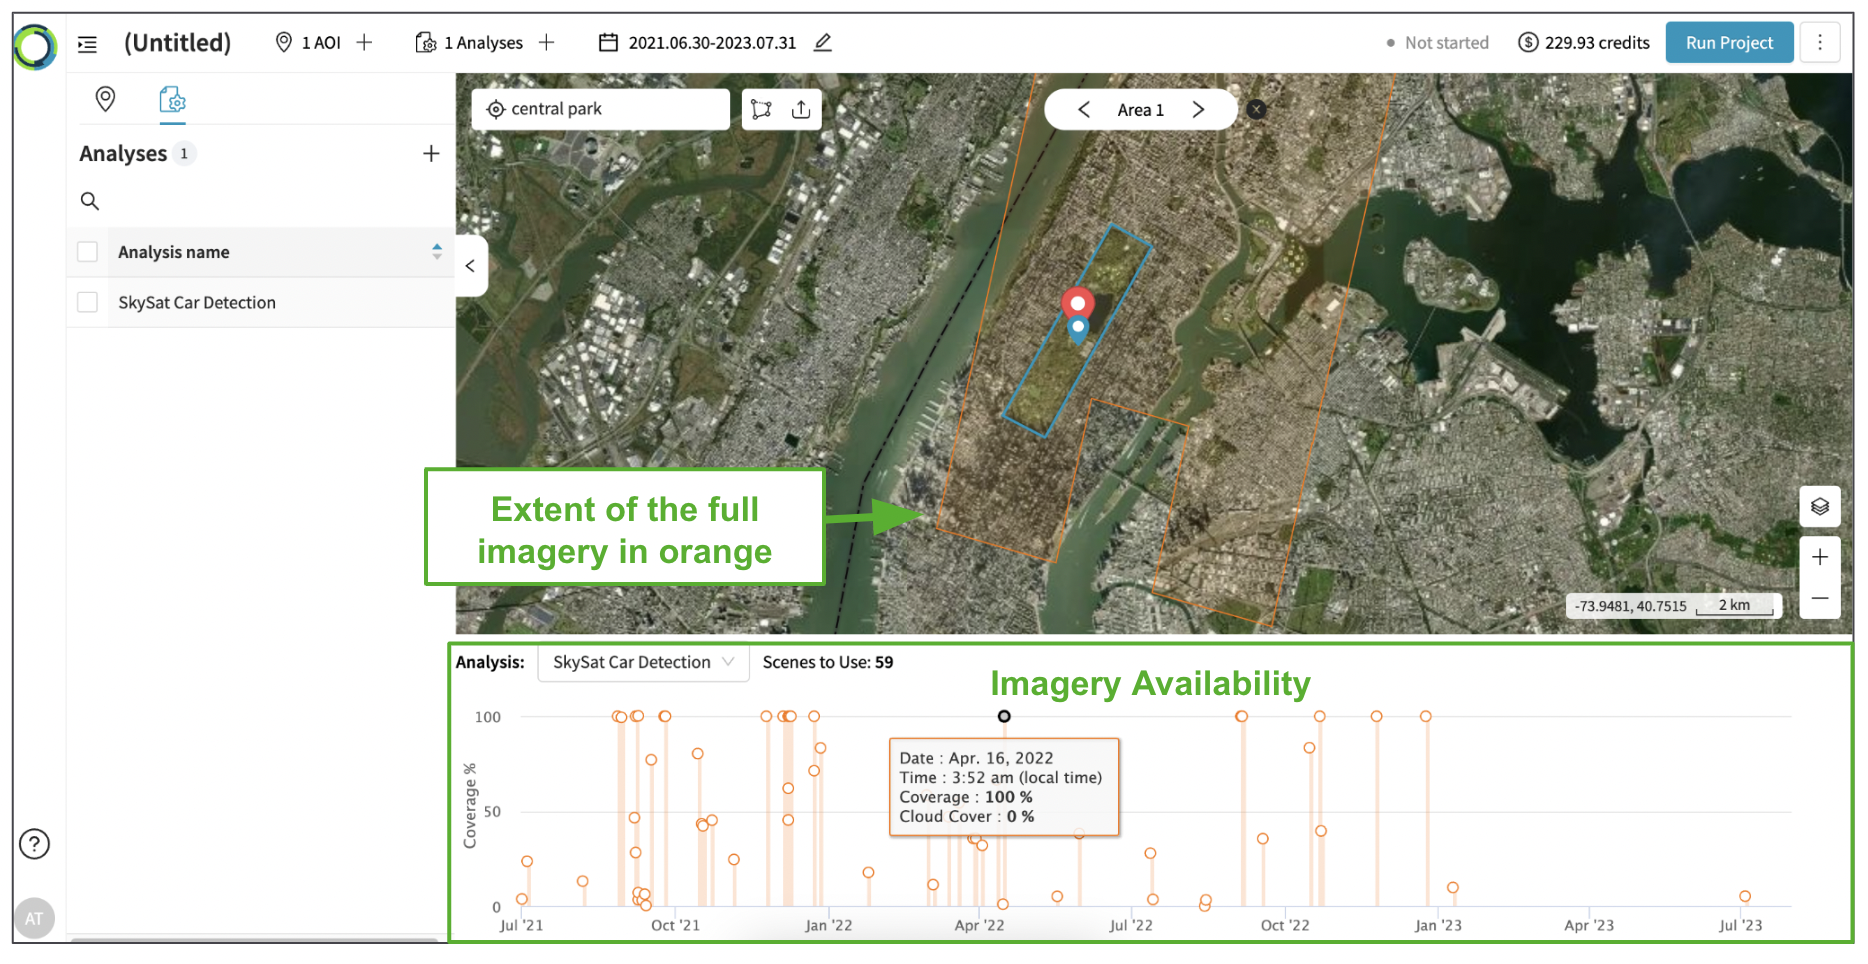
Then, for Object Detection and Land Use analysis, you can see the details of the available imagery for analysis as below:
- Click on each individual AOI to see how much imagery is available to be analyzed.
- The bars in the chart on the bottom correspond to individual "scenes" (satellite images). Each bar corresponds to a single day; click on any bar to see the extents of the full scene, shown on the map in orange.
- If there are multiple scenes on a single day, they will each be displayed as a separate polygon on the map.
Only imagery within your AOI will be analyzedSatellite scenes may be very large in size, but only the part of the scene within your AOI will be analyzed & charged accordingly. This means that you only pay for the part of the scene that is relevant to you.
Updated 6 months ago